

Glutathione precursor N-acetyl-cysteine modulates EEG synchronization in schizophrenia patients: a double-blind, randomized, placebo-controlled trial
- PMID: 22383949
- PMCID: PMC3285150
- DOI: 10.1371/journal.pone.0029341
Glutathione precursor N-acetyl-cysteine modulates EEG synchronization in schizophrenia patients: a double-blind, randomized, placebo-controlled trial
Abstract
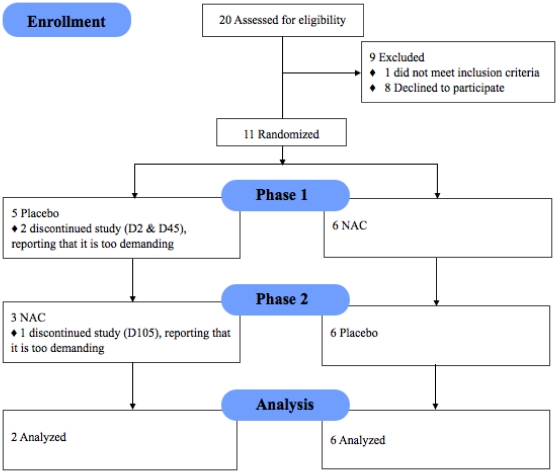
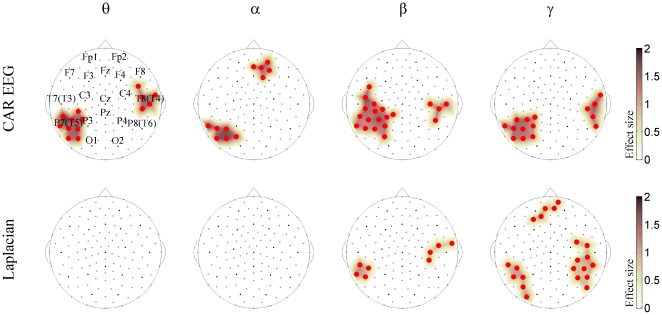
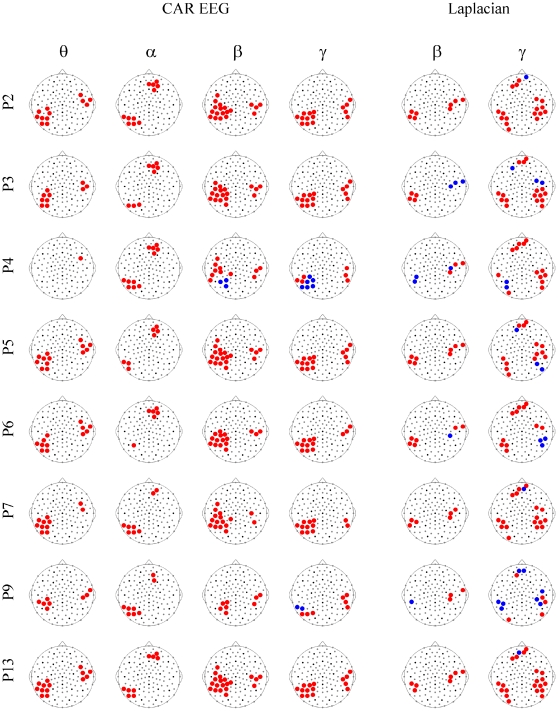
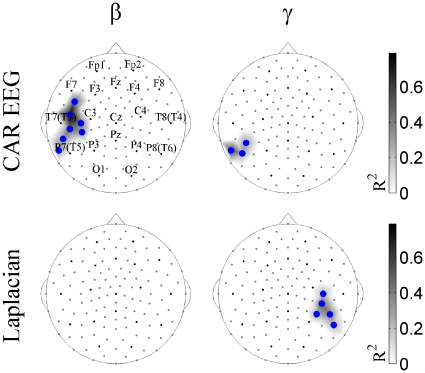
Glutathione (GSH) dysregulation at the gene, protein, and functional levels has been observed in schizophrenia patients. Together with disease-like anomalies in GSH deficit experimental models, it suggests that such redox dysregulation can play a critical role in altering neural connectivity and synchronization, and thus possibly causing schizophrenia symptoms. To determine whether increased GSH levels would modulate EEG synchronization, N-acetyl-cysteine (NAC), a glutathione precursor, was administered to patients in a randomized, double-blind, crossover protocol for 60 days, followed by placebo for another 60 days (or vice versa). We analyzed whole-head topography of the multivariate phase synchronization (MPS) for 128-channel resting-state EEGs that were recorded at the onset, at the point of crossover, and at the end of the protocol. In this proof of concept study, the treatment with NAC significantly increased MPS compared to placebo over the left parieto-temporal, the right temporal, and the bilateral prefrontal regions. These changes were robust both at the group and at the individual level. Although MPS increase was observed in the absence of clinical improvement at a group level, it correlated with individual change estimated by Liddle's disorganization scale. Therefore, significant changes in EEG synchronization induced by NAC administration may precede clinically detectable improvement, highlighting its possible utility as a biomarker of treatment efficacy.
Trial registration: ClinicalTrials.gov NCT01506765.
Conflict of interest statement
Figures
References
-
- Do KQ, Bovet P, Cabungcal JH, Conus P, Gysin R, et al. Redox dysregulation in schizophrenia: genetic susceptibility and pathophysiological mechanisms. In: Lajtha A, editor. Handbook of Neurochemistry and Molecular Neurobiology, Vol 27. New York: Springer; 2009. pp. 285–311.
-
- Do KQ, Cabungcal JH, Frank A, Steullet P, Cuenod M. Redox dysregulation, neurodevelopment, and schizophrenia. Curr Opin Neurobiol. 2009;19:220–230. - PubMed
-
- Do KQ, Trabesinger AH, Kirsten-Kruger M, Lauer CJ, Dydak U, et al. Schizophrenia: glutathione deficit in cerebrospinal fluid and prefrontal cortex in vivo. Eur J Neurosci. 2000;12:3721–3728. - PubMed
-
- Matsuzawa D, Hashimoto K. Magnetic resopnance spectroscopy study of the antioxidant defense system in Schizophrenia. Antioxid Redox Signal. 2011 In press. - PubMed
Publication types
MeSH terms
Substances
Associated data
LinkOut - more resources
Full Text Sources
Other Literature Sources
Medical
