

Type II NKT cells stimulate diet-induced obesity by mediating adipose tissue inflammation, steatohepatitis and insulin resistance
- PMID: 22383967
- PMCID: PMC3284453
- DOI: 10.1371/journal.pone.0030568
Type II NKT cells stimulate diet-induced obesity by mediating adipose tissue inflammation, steatohepatitis and insulin resistance
Abstract
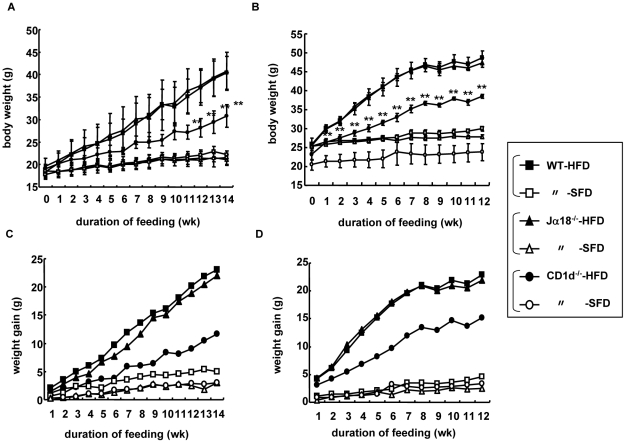
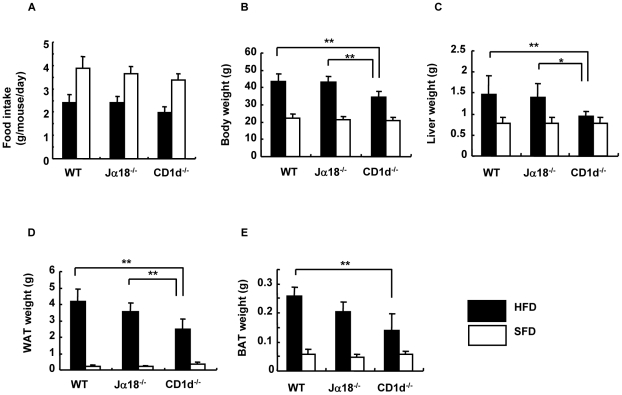
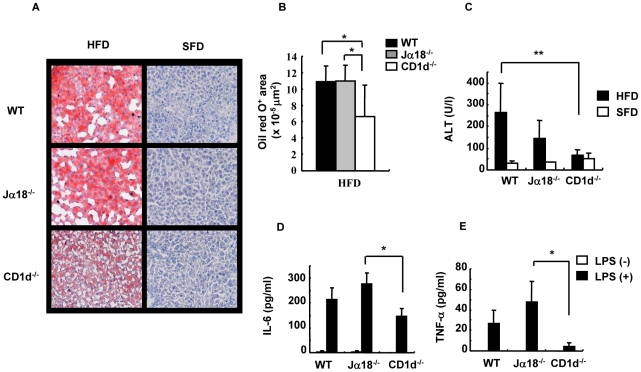
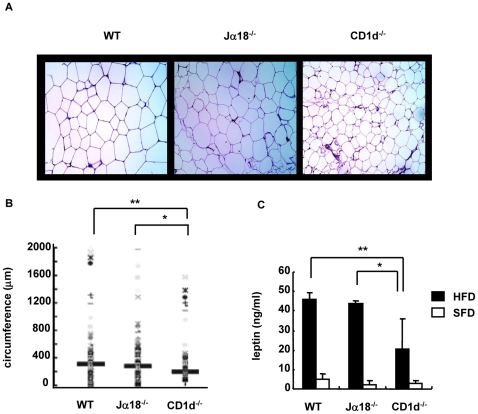
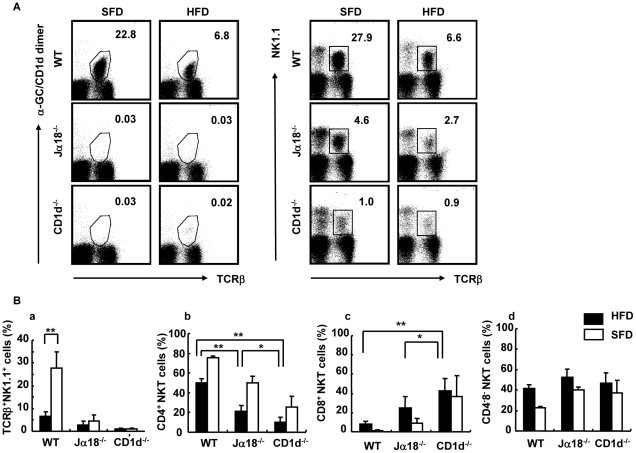
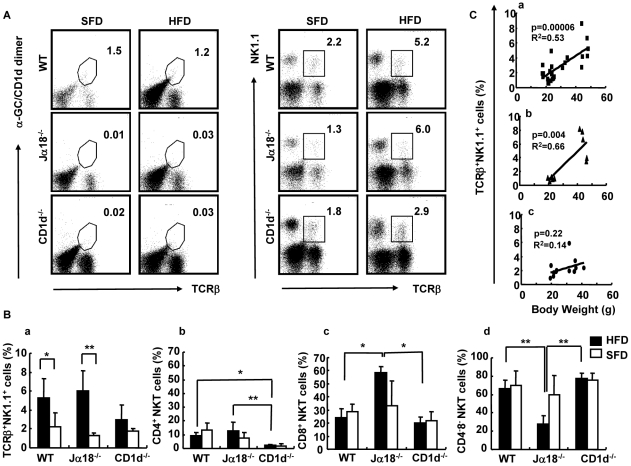
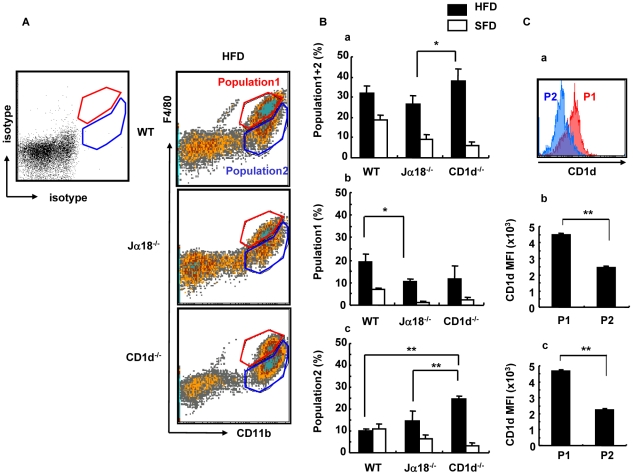
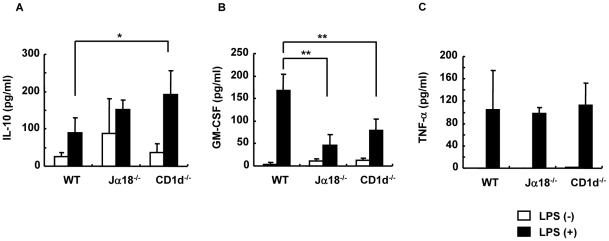
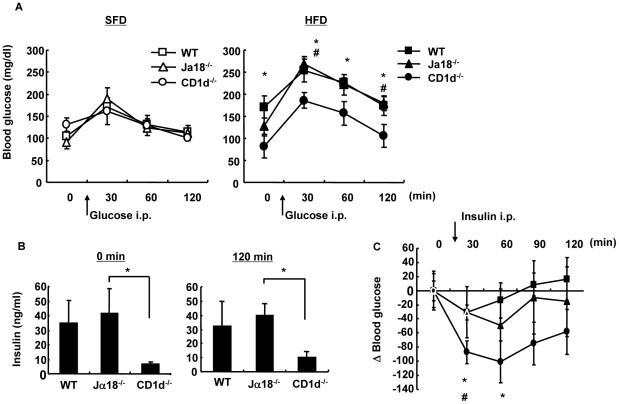
The progression of obesity is accompanied by a chronic inflammatory process that involves both innate and acquired immunity. Natural killer T (NKT) cells recognize lipid antigens and are also distributed in adipose tissue. To examine the involvement of NKT cells in the development of obesity, C57BL/6 mice (wild type; WT), and two NKT-cell-deficient strains, Jα18(-/-) mice that lack the type I subset and CD1d(-/-) mice that lack both the type I and II subsets, were fed a high fat diet (HFD). CD1d(-/-) mice gained the least body weight with the least weight in perigonadal and brown adipose tissue as well as in the liver, compared to WT or Jα18(-/-) mice fed an HFD. Histologically, CD1d(-/-) mice had significantly smaller adipocytes and developed significantly milder hepatosteatosis than WT or Jα18(-/-) mice. The number of NK1.1(+)TCRβ(+) cells in adipose tissue increased when WT mice were fed an HFD and were mostly invariant Vα14Jα18-negative. CD11b(+) macrophages (Mφ) were another major subset of cells in adipose tissue infiltrates, and they were divided into F4/80(high) and F4/80(low) cells. The F4/80(low)-Mφ subset in adipose tissue was increased in CD1d(-/-) mice, and this population likely played an anti-inflammatory role. Glucose intolerance and insulin resistance in CD1d(-/-) mice were not aggravated as in WT or Jα18(-/-) mice fed an HFD, likely due to a lower grade of inflammation and adiposity. Collectively, our findings provide evidence that type II NKT cells initiate inflammation in the liver and adipose tissue and exacerbate the course of obesity that leads to insulin resistance.
Conflict of interest statement
Figures
Similar articles
-
Deficiency of Invariant Natural Killer T Cells Does Not Protect Against Obesity but Exacerbates Atherosclerosis in Ldlr-/- Mice.Int J Mol Sci. 2018 Feb 8;19(2):510. doi: 10.3390/ijms19020510. Int J Mol Sci. 2018. PMID: 29419749 Free PMC article.
-
Lack of invariant natural killer T cells affects lipid metabolism in adipose tissue of diet-induced obese mice.Arterioscler Thromb Vasc Biol. 2013 Jun;33(6):1189-96. doi: 10.1161/ATVBAHA.112.301105. Epub 2013 Mar 21. Arterioscler Thromb Vasc Biol. 2013. PMID: 23520162
-
Mice lacking NKT cells but with a complete complement of CD8+ T-cells are not protected against the metabolic abnormalities of diet-induced obesity.PLoS One. 2011;6(6):e19831. doi: 10.1371/journal.pone.0019831. Epub 2011 Jun 3. PLoS One. 2011. PMID: 21674035 Free PMC article.
-
Adipocyte CD1d determines adipose inflammation and insulin resistance in obesity.Adipocyte. 2018;7(2):129-136. doi: 10.1080/21623945.2018.1440928. Epub 2018 Mar 6. Adipocyte. 2018. PMID: 29509047 Free PMC article. Review.
-
Contribution of NKT cells and CD1d-expressing cells in obesity-associated adipose tissue inflammation.Front Immunol. 2024 Feb 15;15:1365843. doi: 10.3389/fimmu.2024.1365843. eCollection 2024. Front Immunol. 2024. PMID: 38426085 Free PMC article. Review.
Cited by
-
Natural killer T cells are required for lipopolysaccharide-mediated enhancement of atherosclerosis in apolipoprotein E-deficient mice.Immunobiology. 2013 Apr;218(4):561-9. doi: 10.1016/j.imbio.2012.07.022. Epub 2012 Jul 27. Immunobiology. 2013. PMID: 22954709 Free PMC article.
-
The Response of CD1d-Restricted Invariant NKT Cells to Microbial Pathogens and Their Products.Front Immunol. 2015 May 13;6:226. doi: 10.3389/fimmu.2015.00226. eCollection 2015. Front Immunol. 2015. PMID: 26029211 Free PMC article. Review.
-
Cytokine Output of Adipocyte-iNKT Cell Interplay Is Skewed by a Lipid-Rich Microenvironment.Front Endocrinol (Lausanne). 2020 Jul 31;11:479. doi: 10.3389/fendo.2020.00479. eCollection 2020. Front Endocrinol (Lausanne). 2020. PMID: 32849273 Free PMC article.
-
The immune system as a sensor of the metabolic state.Immunity. 2013 Apr 18;38(4):644-54. doi: 10.1016/j.immuni.2013.04.001. Immunity. 2013. PMID: 23601683 Free PMC article. Review.
-
Leukocyte Heterogeneity in Adipose Tissue, Including in Obesity.Circ Res. 2020 May 22;126(11):1590-1612. doi: 10.1161/CIRCRESAHA.120.316203. Epub 2020 May 21. Circ Res. 2020. PMID: 32437300 Free PMC article. Review.
References
-
- Kintscher U, Hartge M, Hess K, Foryst-Ludwig A, Clemenz M, et al. T-lymphocyte infiltration in visceral adipose tissue: a primary event in adipose tissue inflammation and the development of obesity-mediated insulin resistance. Arterioscler Thromb Vasc Biol. 2008;28:1304–10. - PubMed
-
- Waki H, Tontonoz P. Endocrine functions of adipose tissue. Annu Rev Pathol Mech Dis. 2007;2:31–56. - PubMed
-
- Hotamisligil GS. Inflammtion and metabolic disorders. Nature. 2006;444:860–867. - PubMed
Publication types
MeSH terms
Substances
LinkOut - more resources
Full Text Sources
Other Literature Sources
Medical
Molecular Biology Databases
Research Materials
