

A bistable model of cell polarity
- PMID: 22383986
- PMCID: PMC3285628
- DOI: 10.1371/journal.pone.0030977
A bistable model of cell polarity
Abstract
Ultrasensitivity, as described by Goldbeter and Koshland, has been considered for a long time as a way to realize bistable switches in biological systems. It is not as well recognized that when ultrasensitivity and reinforcing feedback loops are present in a spatially distributed system such as the cell plasmamembrane, they may induce bistability and spatial separation of the system into distinct signaling phases. Here we suggest that bistability of ultrasensitive signaling pathways in a diffusive environment provides a basic mechanism to realize cell membrane polarity. Cell membrane polarization is a fundamental process implicated in several basic biological phenomena, such as differentiation, proliferation, migration and morphogenesis of unicellular and multicellular organisms. We describe a simple, solvable model of cell membrane polarization based on the coupling of membrane diffusion with bistable enzymatic dynamics. The model can reproduce a broad range of symmetry-breaking events, such as those observed in eukaryotic directional sensing, the apico-basal polarization of epithelium cells, the polarization of budding and mating yeast, and the formation of Ras nanoclusters in several cell types.
Conflict of interest statement
Figures
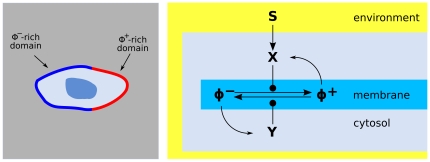
 transduces an external distribution of chemotactic cues into an internal distribution of activated enzymes
  , which catalyze the switch of a signaling molecule
  from an unactivated state
  to an activated state
  . A counteracting enzyme
  transforms the
  state back into
  . The network contains a couple of amplifying feedback loops: the signaling molecule
  activates
  and
and  acvivates
  . The signaling molecules
  ,
,  are permanently bound to the cell surface
  and perform diffusive motions on it, while the
  ,
,  enzymes are free to shuttle between the cytosolic reservoir and the membrane. The result of the polarization process is the formation of separate domains with
  -rich patches and, respectively,
  -rich patches.
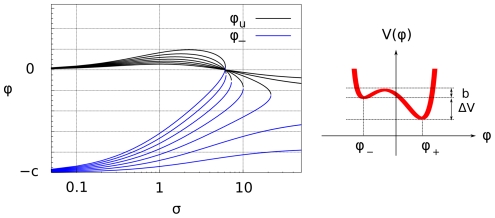
 and unstable chemical phase
  , as a function of the renormalized activation signal
  (19) (black) and for different values of the saturation constant
  . Right: Behavior of the potential
  , as a function of the phase
  , see (13). The potential
  has two minima: the left-hand one corresponding to a stable
  -rich and the right-hand one corresponding to a stable
  -rich phase. The two phases are separated by an effective energy barrier. The existence of the two distinct stable chemical phases is called bistability.
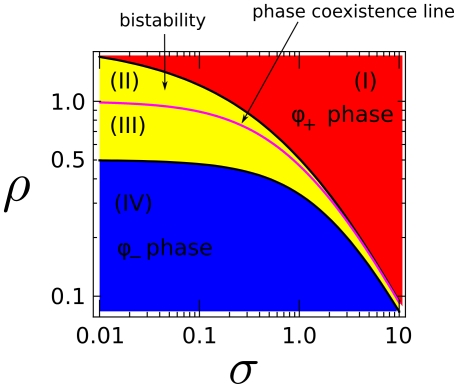
 for
for
 . The purple line corresponds to phase coexistence (polarization) and is an attractor for the polarization dynamics. The two stable domains, blue (IV) and red (I), correspond to the two
  and
and  stable phases.
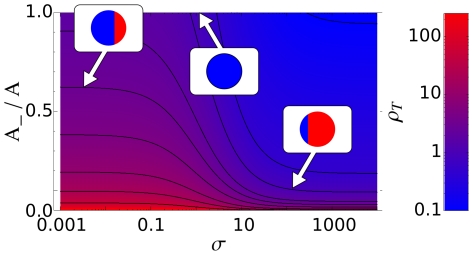
 and
and
 phases have areas, respectively,
 and
and
 . Here we show the ratio
  at different values of the stimulation
  . Curves are plotted from top to bottom with increasing ratio of the initial enzymes quantities
  . Each curve shows two plateaux that are approximatively independent of the signal
  . For small
  the system is dominated by the mutual interaction between
  and
and  , i.e., by the feedback loop, whilst for large
  the system is dominated by the interaction with receptors, i.e., by the external signal.
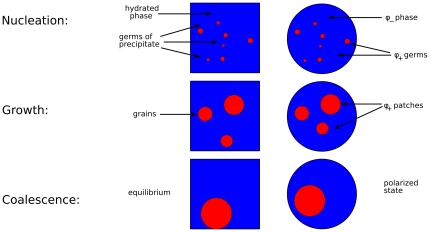
 is higher than the critical value
  , so that a small fluctuation, or an impurity, can easily give rise to the formation of small germs of precipitate. Germs larger than a critical size
  grow steadily, while germs smaller than
  are dissolved by diffusion. As the size of the germs grows, the molecule
  is extracted from the hydrated phase and transferred to the solid phase, moving the concentration
  closer to the critical value
  , increasing the value of
  , and correspondingly slowing down the process of germ growth. Grains that were initially larger than
  are dissolved, so that larger grains grow at the expense of the smaller grains. Eventually, an equilibrium is reached when
  and a single large grain of precipitate survives.
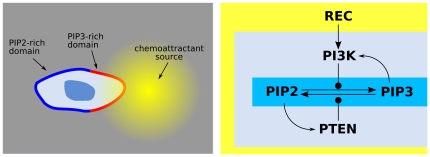
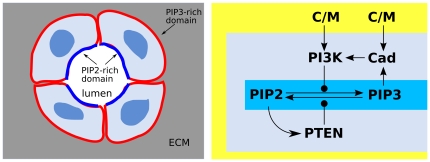
 = PIP3,
  = PIP2,
  REC. The PIP3-rich domain corresponds to the presence of a high concentration of chemoattractant factor.
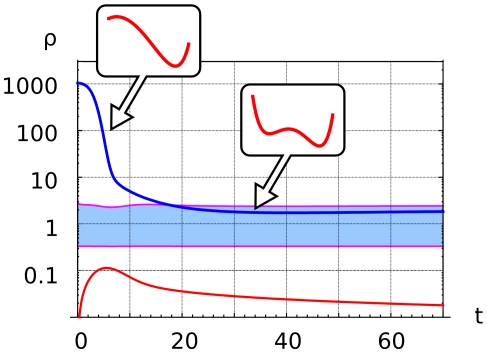
 , that follows the slow variation of the enzyme ratio
  . Receptor activation at
  (blue line) induces a uniform increase of PI3K, PIP3 on the whole plasmamembrane, which corresponds to the appearance of a single potential well centered in the PIP3-rich region. The enzyme ratio
  decreases, corresponding to PI3K recruitment to the plasmamembrane and PTEN relocation to the cytosol (blue line). When the enzyme ratio crosses the boundary of the bistable region (light blue area) the effective potential
  develops a secondary potential well centered in the PIP2-rich region.
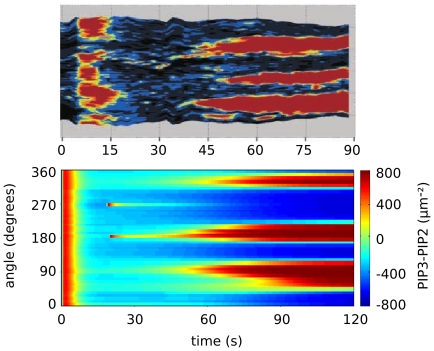
 , when we also impose a gaussian noise on the uniform concentration background in order to mimick random inhomogeneities. We compare the experimental results reported in Reference with the simulations of model (1–8). The kimograph shows the time evolution of simulated PIP3 levels along the major cell perimeter. Time
  in the simulation is to be compared with time
  s in the experiment.
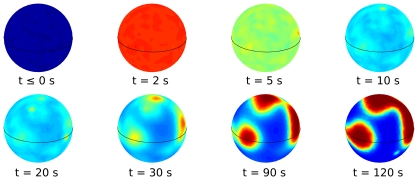
 ,
,
 ,
,
 ,
,
 , and
, and
 C/M. To bind PI3K, cadherins must be activated by engagement with cadherins of a neighboring cell. The PIP2, PIP3 localization is central in the establishment of epithelial apico-basal orientation.
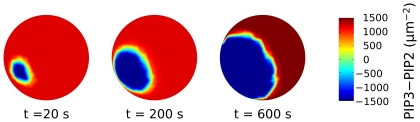
 ,
,  ,
,  ,
,  .
.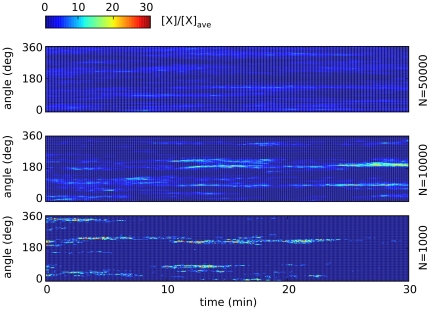
 thick cross section of the plasmamembrane vs. time, normalized with the average membrane concentration. Upper three rows: small number
  of A-molecules (PTEN in Ref. , or Cdc24 in Ref. [45]). Intermittent polarization as shown here was already described in . The graphs of our realistic surface model are similar to those obtained in Ref. in the monodimensional case. Patches of signaling molecules randomly form and disappear. Observe that patches are the macroscopic counterpart of clans of signaling molecules, as defined in . Parameter values were taken as follows: diffusivity of membrane-bound molecules is
  ,
,  , [A] = 1, 10, 50 nM, the decay rate of
  is adjusted in order to get 10% of A molecules bound to the plasmamembrane, all other parameters are as in , .
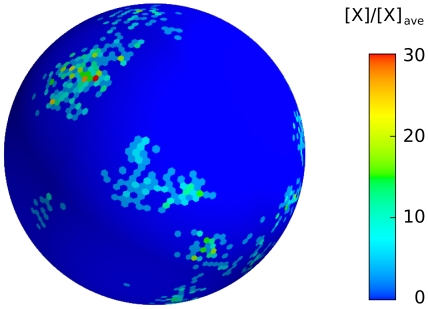
 patches. The graphs of our realistic surface model are similar to those obtained in the one-dimensional model of Ref. . It is worth observing here that intermittent, as opposed to stable, patch formation is here a consequence of the particular, small-concentration limit considered in .
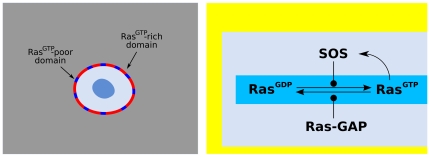
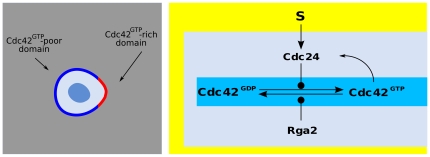
 ,
,  ,
,  ,
,  -GAP.
-GAP.References
-
- Gamba A, Kolokolov I, Lebedev V, Ortenzi G. Patch coalescence as a mechanism for eukaryotic directional sensing. Phys Rev Lett. 2007;99:158101–1–4. - PubMed
-
- Gamba A, Kolokolov I, Lebedev V, Ortenzi G. Universal features of cell polarization processes. J Stat Mech. 2009;2009:P02019.
-
- Wedlich-Soldner R, Li R. Spontaneous cell polarization: undermining determinism. Nat Cell Biol. 2003;5:267–70. - PubMed
-
- Kriebel PW, Barr VA, Parent CA. Adenylyl cyclase localization regulates streaming during chemotaxis. Cell. 2003;112:549–60. - PubMed
