Identification of new genes involved in human adipogenesis and fat storage
- PMID: 22384002
- PMCID: PMC3287999
- DOI: 10.1371/journal.pone.0031193
Identification of new genes involved in human adipogenesis and fat storage
Abstract
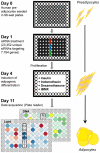
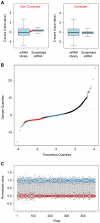
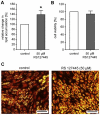
Since the worldwide increase in obesity represents a growing challenge for health care systems, new approaches are needed to effectively treat obesity and its associated diseases. One prerequisite for advances in this field is the identification of genes involved in adipogenesis and/or lipid storage. To provide a systematic analysis of genes that regulate adipose tissue biology and to establish a target-oriented compound screening, we performed a high throughput siRNA screen with primary (pre)adipocytes, using a druggable siRNA library targeting 7,784 human genes. The primary screen showed that 459 genes affected adipogenesis and/or lipid accumulation after knock-down. Out of these hits, 333 could be validated in a secondary screen using independent siRNAs and 110 genes were further regulated on the gene expression level during adipogenesis. Assuming that these genes are involved in neutral lipid storage and/or adipocyte differentiation, we performed InCell-Western analysis for the most striking hits to distinguish between the two phenotypes. Beside well known regulators of adipogenesis and neutral lipid storage (i.e. PPARγ, RXR, Perilipin A) the screening revealed a large number of genes which have not been previously described in the context of fatty tissue biology such as axonemal dyneins. Five out of ten axonemal dyneins were identified in our screen and quantitative RT-PCR-analysis revealed that these genes are expressed in preadipocytes and/or maturing adipocytes. Finally, to show that the genes identified in our screen are per se druggable we performed a proof of principle experiment using an antagonist for HTR2B. The results showed a very similar phenotype compared to knock-down experiments proofing the "druggability". Thus, we identified new adipogenesis-associated genes and those involved in neutral lipid storage. Moreover, by using a druggable siRNA library the screen data provides a very attractive starting point to identify anti-obesity compounds targeting the adipose tissue.
Conflict of interest statement
Figures


Similar articles
-
De-novo identification of PPARgamma/RXR binding sites and direct targets during adipogenesis.PLoS One. 2009;4(3):e4907. doi: 10.1371/journal.pone.0004907. Epub 2009 Mar 20. PLoS One. 2009. PMID: 19300518 Free PMC article.
-
Gene expression profiling of subcutaneous adipose tissue in morbid obesity using a focused microarray: distinct expression of cell-cycle- and differentiation-related genes.BMC Med Genomics. 2010 Dec 23;3:61. doi: 10.1186/1755-8794-3-61. BMC Med Genomics. 2010. PMID: 21182758 Free PMC article.
-
Fam57b (family with sequence similarity 57, member B), a novel peroxisome proliferator-activated receptor γ target gene that regulates adipogenesis through ceramide synthesis.J Biol Chem. 2013 Feb 15;288(7):4522-37. doi: 10.1074/jbc.M112.440792. Epub 2012 Dec 28. J Biol Chem. 2013. PMID: 23275342 Free PMC article.
-
Adipogenic miRNA and meta-signature miRNAs involved in human adipocyte differentiation and obesity.Oncotarget. 2016 Jun 28;7(26):40830-40845. doi: 10.18632/oncotarget.8518. Oncotarget. 2016. PMID: 27049726 Free PMC article. Review.
-
microRNAs in the regulation of adipogenesis and obesity.Curr Mol Med. 2011 Jun;11(4):304-16. doi: 10.2174/156652411795677990. Curr Mol Med. 2011. PMID: 21506921 Free PMC article. Review.
Cited by
-
Transcriptome Analysis Reveals Genes Involved in Thermogenesis in Two Cold-Exposed Sheep Breeds.Genes (Basel). 2021 Mar 6;12(3):375. doi: 10.3390/genes12030375. Genes (Basel). 2021. PMID: 33800742 Free PMC article.
-
5-HT Receptors and Temperature Homeostasis.Biomolecules. 2021 Dec 20;11(12):1914. doi: 10.3390/biom11121914. Biomolecules. 2021. PMID: 34944557 Free PMC article. Review.
-
Genome-wide association study for feed efficiency and growth traits in U.S. beef cattle.BMC Genomics. 2017 May 18;18(1):386. doi: 10.1186/s12864-017-3754-y. BMC Genomics. 2017. PMID: 28521758 Free PMC article.
-
Remodeling adipose tissue through in silico modulation of fat storage for the prevention of type 2 diabetes.BMC Syst Biol. 2017 Jun 12;11(1):60. doi: 10.1186/s12918-017-0438-9. BMC Syst Biol. 2017. PMID: 28606124 Free PMC article.
-
Skeletal Muscles of Sedentary and Physically Active Aged People Have Distinctive Genic Extrachromosomal Circular DNA Profiles.Int J Mol Sci. 2023 Feb 1;24(3):2736. doi: 10.3390/ijms24032736. Int J Mol Sci. 2023. PMID: 36769072 Free PMC article.
References
-
- Prentice AM. The emerging epidemic of obesity in developing countries. Int J Epidemiol. 2006;35:93–99. - PubMed
-
- Cecchini M, Sassi F, Lauer JA, Lee YY, Guajardo-Barron V, et al. Tackling of unhealthy diets, physical inactivity, and obesity: health effects and cost-effectiveness. Lancet. 2010;376:1775–1784. - PubMed
-
- WHO. Report of a WHO Consultation, WHO Technical Report Series No. 894. Geneva: World Health Organization; 2000. Obesity: preventing and managing the global epidemic. - PubMed
-
- Rosen ED, Walkey CJ, Puigserver P, Spiegelman BM. Transcriptional regulation of adipogenesis. Genes Dev. 2000;14:1293–1307. - PubMed
MeSH terms
Substances
Associated data
- Actions
LinkOut - more resources
Full Text Sources
Molecular Biology Databases

