. 2012;7(2):e31537.
doi: 10.1371/journal.pone.0031537. Epub 2012 Feb 27.

Spectrotemporal processing in spectral tuning modules of cat primary auditory cortex

Affiliations

Spectrotemporal processing in spectral tuning modules of cat primary auditory cortex

Craig A Atencio et al. PLoS One. 2012.

Abstract

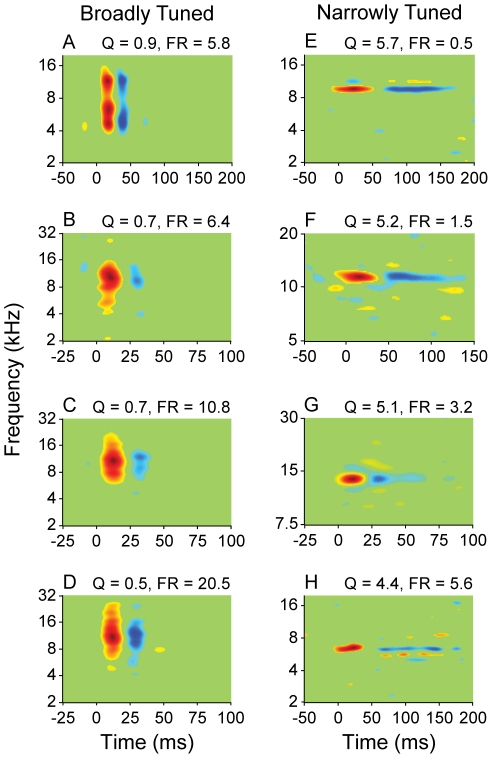
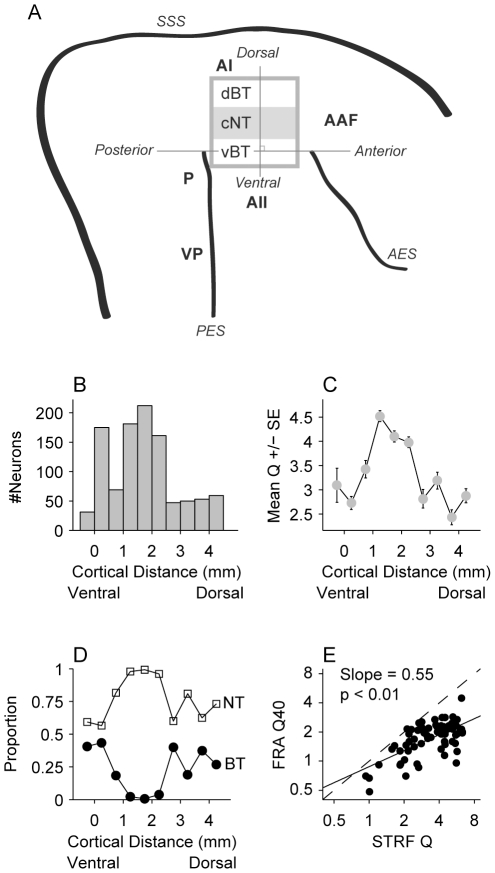
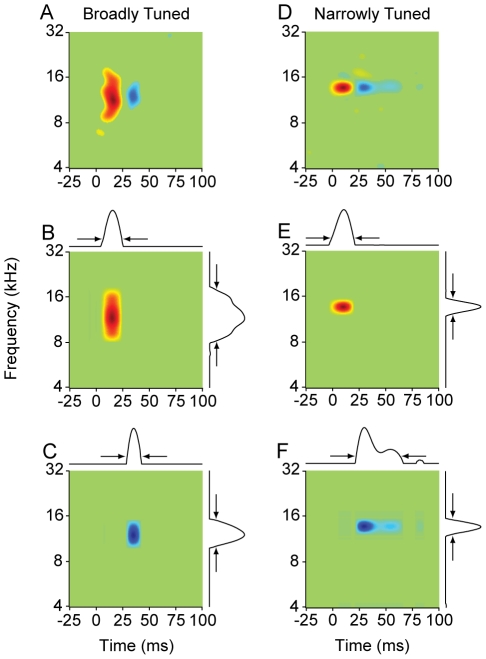
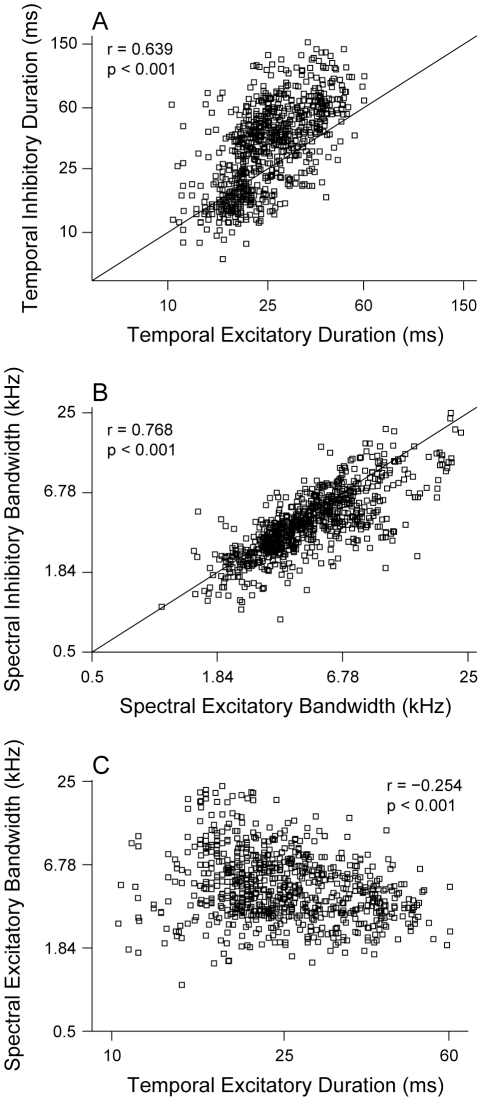
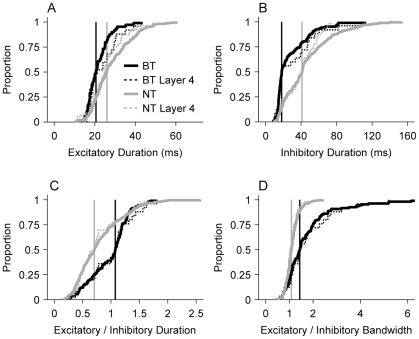
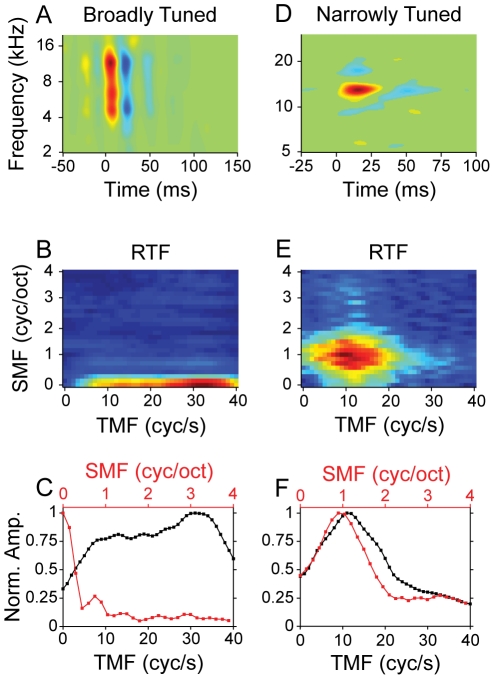
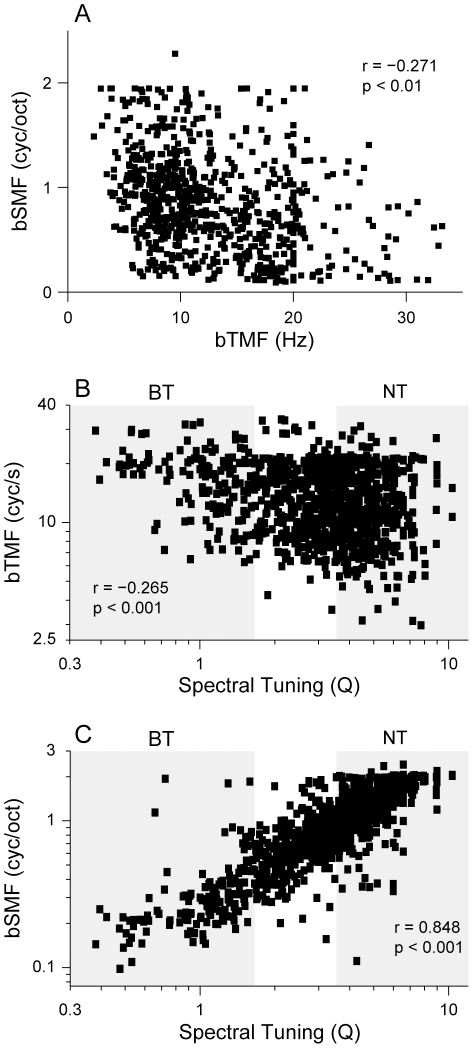
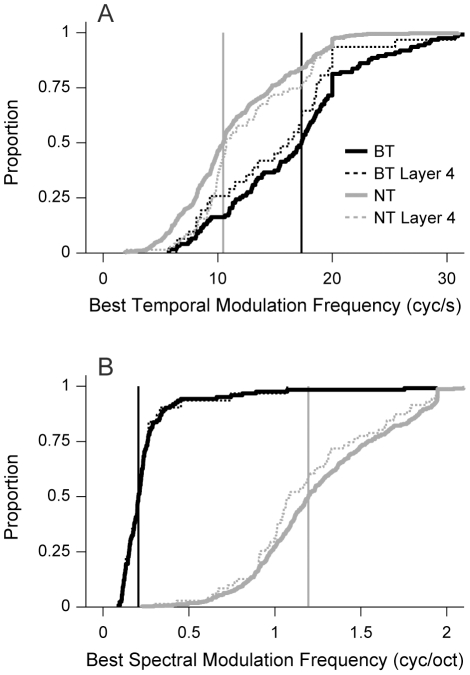
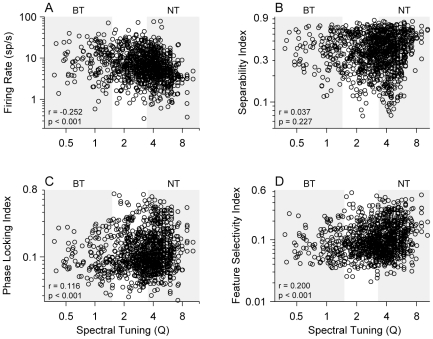
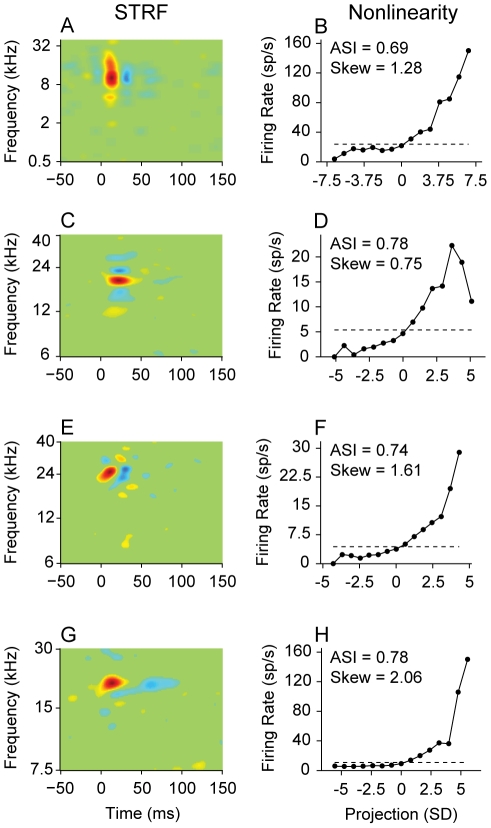
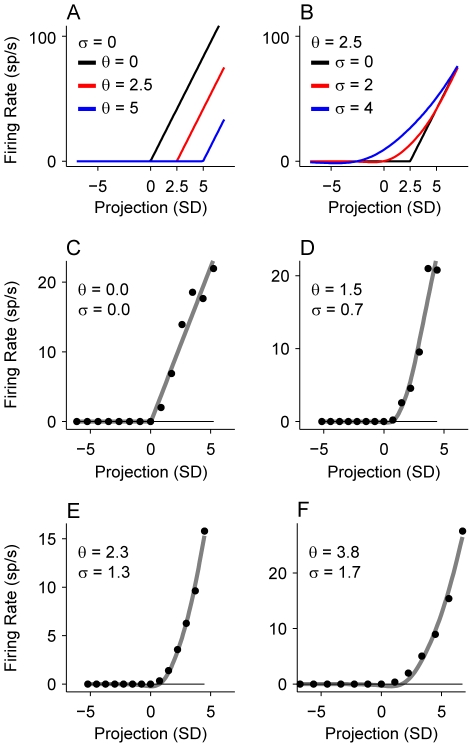
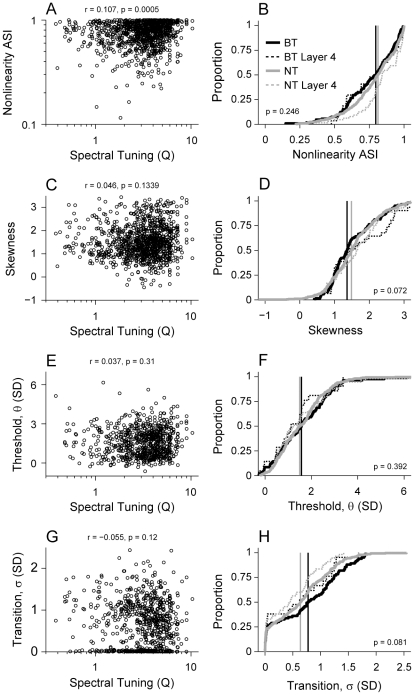
Spectral integration properties show topographical order in cat primary auditory cortex (AI). Along the iso-frequency domain, regions with predominantly narrowly tuned (NT) neurons are segregated from regions with more broadly tuned (BT) neurons, forming distinct processing modules. Despite their prominent spatial segregation, spectrotemporal processing has not been compared for these regions. We identified these NT and BT regions with broad-band ripple stimuli and characterized processing differences between them using both spectrotemporal receptive fields (STRFs) and nonlinear stimulus/firing rate transformations. The durations of STRF excitatory and inhibitory subfields were shorter and the best temporal modulation frequencies were higher for BT neurons than for NT neurons. For NT neurons, the bandwidth of excitatory and inhibitory subfields was matched, whereas for BT neurons it was not. Phase locking and feature selectivity were higher for NT neurons. Properties of the nonlinearities showed only slight differences across the bandwidth modules. These results indicate fundamental differences in spectrotemporal preferences--and thus distinct physiological functions--for neurons in BT and NT spectral integration modules. However, some global processing aspects, such as spectrotemporal interactions and nonlinear input/output behavior, appear to be similar for both neuronal subgroups. The findings suggest that spectral integration modules in AI differ in what specific stimulus aspects are processed, but they are similar in the manner in which stimulus information is processed.


Conflict of interest statement

Competing Interests: The authors have declared that no competing interests exist.

Figures

Figure 1
Figure 1. STRFs of broadly and narrowly tuned AI neurons.
(A–D) Broadly tuned neurons. (E–H) Narrowly tuned neurons. Q: quality factor, which is the spectral tuning metric. FR: firing rate.
Figure 2
Figure 2. Recording location analysis.
For each experiment, recording locations were noted on a digital photo of AI. Locations were estimated along the dorsal-ventral axis of AI by projecting the recording position onto a line that was orthogonal to a line connecting the tips of the anterior and posterior ectosylvian sulci. (A) Schematic of auditory cortex and spectral tuning modules. Rectangle in AI represents the region within AI where spectral tuning modules are present (dBT: dorsal broadband region; cNT: central narrowband region; vBT: ventral broadband region). Dorsal-ventral position of each electrode penetration was calculated by projecting recording sites onto the line that is orthogonal to the line connecting the posterior ectosylvian (PES) and anterior ectosylvian sulcus (AES). SSS: suprasylvian sulcus. AAF: anterior auditory field; AII: secondary auditory field; P: posterior auditory field; VP: Ventral-posterior auditory field. (B) Number of recorded neurons along the dorsal-ventral axis. (C) Mean STRF Q values along the dorsal-ventral axis. Tuning is sharpest in the central region of AI. (D) For broadly tuned (BT) and narrowly tuned (NT) neurons, the proportion of each along the dorsal-ventral axis. BT neurons had STRF Q values < = 1.5, and NT neurons had Q values > = 3.5. Almost no BT neurons are found within the central region of AI. (E) Relation between STRF Q values and frequency response area (FRA) Q40 values. Dashed line represents equality, and solid line represents the best fit (slope = 0.55, p<0.01, t-test).
Figure 3
Figure 3. Method for determining the temporal and spectral extent of excitatory and inhibitory STRF subfields.
Each column represents one neuron (A–C: broadly tuned; D–F: narrowly tuned). Singular value decomposition (SVD) was performed on either the excitatory (B,E) or inhibitory subfield (C,F). Time and frequency 1D marginals are shown above, and to the right, of each separable component in B, C, E, F. The first separable component from the SVD analysis was used to extract the subfield width at 10% of the peak value (arrows).
Figure 4
Figure 4. Comparison of temporal and spectral STRF subfield duration and bandwidth.
(A) Temporal inhibitory STRF subfield duration versus temporal excitatory subfield duration. Inhibitory duration was longer than excitatory duration (r = 0.639, p<0.001, t-test). (B) Spectral STRF bandwidth for inhibitory versus excitatory subfields. Bandwidth for excitation was generally similar to the bandwidth for inhibition (r = 0.768, p<0.001, t-test). (C) Excitatory STRF subfield bandwidth versus duration. Excitatory bandwidth decreases slightly with increasing duration (r = −0.254, p<0.001, t-test).
Figure 5
Figure 5. Comparison between BT and NT neuron STRF subfield duration and bandwidth.
(A) Cumulative distribution function (CDF) of excitatory subfield durations. Solid lines represent total population data. Vertical lines indicate population medians. Dashed lines represent values exclusively from layer 4 neurons (800–1100 µm cortical depth). NT neurons have significantly longer excitatory subfield durations (p<0.001, KS-test). (B) CDF of inhibitory duration. BT neurons had shorter inhibitory subfields (p<0.001, KS-test). (C) CDF of the ratio of excitatory to inhibitory duration. For BT neurons, the temporal duration of excitation is similar to the duration of inhibition (p<0.001, KS-test). (D) CDF of the ratio of excitatory to inhibitory bandwidth. For BT neurons, excitatory bandwidth was greater than inhibitory bandwidth. For NT neurons, the bandwidths were similar (p<0.001, KS-test).
Figure 6
Figure 6. Modulation processing analysis.
(A) Broadly tuned neuron STRF. (D) Narrowly tuned neuron STRF. (B,E) Ripple Transfer Functions (RTFs) of the STRFs. (C,F) Temporal (black) and Spectral (red) modulation transfer functions (MTFs) are obtained from the RTF by summing across spectral or temporal modulation frequency, respectively. (C) The BT neuron has bandpass tuning for temporal modulations, and lowpass tuning for spectral modulations. (F) The NT neuron has bandpass tuning for both temporal and spectral modulations.
Figure 7
Figure 7. Best modulation frequency.
(A) Best spectral modulation frequency (bSMF) versus best temporal modulation frequency (bTMF). bSMF is weakly correlated with bTMF (r = −0.271, p<0.01, t-test). (B) bTMFs decrease as tuning sharpness increases (p = −0.265, p<0.001, t-test). (C) bSMF is highly correlated with spectral tuning (r = 0.848, p<0.001, t-test). Shaded areas in (B,C) indicate Broadly Tuned (BT) and Narrowly Tuned (NT) neurons.
Figure 8
Figure 8. Best modulation frequencies of BT and NT AI neurons.
(A) Distribution of best temporal modulation frequencies (bTMFs). Solid lines represent population data. Vertical lines indicate population medians. Dashed lines represent values for neurons in layer 4 (800–1100 µm). BT neurons had higher bTMFs (p<0.001, KS-test). BT neurons have significantly higher bTMFs. (B) Distribution of best spectral modulation frequencies (bSMFs). NT neurons had higher bSMFs (p<0.001, KS-test).
Figure 9
Figure 9. STRF parameters versus spectral tuning (Q).
(A) Firing rate is weakly correlated with Q (r = −0.252, p<0.001, t-test). (B) Phase locking index is weakly correlated with Q (r = 0.116, p<0.001, t-test). (C) STRF separability is uncorrelated with Q (r = 0.037, p = 0.227, t-test). (D) Feature selectivity index is weakly correlated with Q (r = 0.200, p<0.001, t-test). Shaded areas Broadly Tuned (BT) and Narrowly Tuned (NT) neurons.
Figure 10
Figure 10. STRF and nonlinearity examples.
Each row corresponds to one neuron. (A) BT neuron STRF and (B) corresponding nonlinearity. Dashed line: average firing rate of the neuron during the ripple stimulus. Noted for each neuron are: nonlinearity asymmetry index (ASI; asymmetry of nonlinearity) and nonlinearity skewness (Skew). Firing rate increases as the projection of the stimulus onto the STRF increases (or, equivalently, as the correlation, or similarity, between the stimulus and the STRF increases). (C–H) additional STRF-nonlinearity examples. Abscissas of nonlinearities are in units of standard deviation (SD), where the value indicates the stimulus similarity relative to a randomly selected stimulus pattern. Example: a value of 3 SD represents a similarity value that would on average not be expected for a randomly spiking neuron.
Figure 11
Figure 11. Parametric analysis of STRF nonlinearities.
(A) Example parametric curves. In these examples the transition noise σ is set to 0, and the threshold θ is varied. (B) Example parametric curves with the threshold θ held constant at 2.5 and the transition noise σ varied. (C–F) Example nonlinearities from data (black dots) and corresponding parametric curve fits in gray. Threshold and transition values for each curve fit are shown in insets as θ and σ.
Figure 12
Figure 12. Nonlinearity parameters versus spectral tuning (Q).
(A) Nonlinearity asymmetry index (ASI) was weakly correlated with increasing Q (r = 0.107, p<0.001, t-test). (B) BT and NT neurons had similar ASI distributions. Solid lines represent population data. Vertical lines indicate population medians (BT median = 0.79, NT median = 0.81, p = 0.246, KS-test). Dashed lines represent values for neurons in layer 4 (800–1100 µm). (C) Nonlinearity skewness was not significantly correlated with Q (r = 0.046, p = 0.134, t-test). (D) Skewness was significantly different for BT and NT neurons (BT median = 1.36, NT median = 1.49, p = 0.072, KS-test). (E) Nonlinearity threshold, θ, was not correlated with Q (r = 0.037, p = 0.31, t-test). (F) Threshold was similar for BT and NT neurons (BT median = 1.57, NT median = 1.49, p = 0.392, KS-test). (G) Nonlinearity transition noise, σ, was not correlated with Q (r = −0.055, p<0.12, t-test). (H) Nonlinearity transition was similar for BT and NT neurons (BT median = 0.77, NT median = 0.64, p = 0.081, KS-test).

Similar articles

Cited by

References

    1. Atencio CA, Schreiner CE. Laminar diversity of dynamic sound processing in cat primary auditory cortex. J Neurophysiol. 2010;103:192–205. - PMC - PubMed
    1. Atencio CA, Schreiner CE. Columnar connectivity and laminar processing in cat primary auditory cortex. PLoS One. 2010;5:e9521. - PMC - PubMed
    1. Atencio CA, Sharpee TO, Schreiner CE. Hierarchical computation in the canonical auditory cortical circuit. Proc Natl Acad Sci USA. 2009;106:21894–21899. - PMC - PubMed
    1. Gilbert CD, Wiesel TN. Clustered intrinsic connections in cat visual cortex. J Neurosci. 1983;3:1116–1133. - PMC - PubMed
    1. Ts'o DY, Gilbert CD, Wiesel TN. Relationships between horizontal interactions and functional architecture in cat striate cortex as revealed by cross-correlation analysis. J Neurosci. 1986;6:1160–1170. - PMC - PubMed

Publication types