

Mechanism-based screen establishes signalling framework for DNA damage-associated G1 checkpoint response
- PMID: 22384045
- PMCID: PMC3288045
- DOI: 10.1371/journal.pone.0031627
Mechanism-based screen establishes signalling framework for DNA damage-associated G1 checkpoint response
Abstract
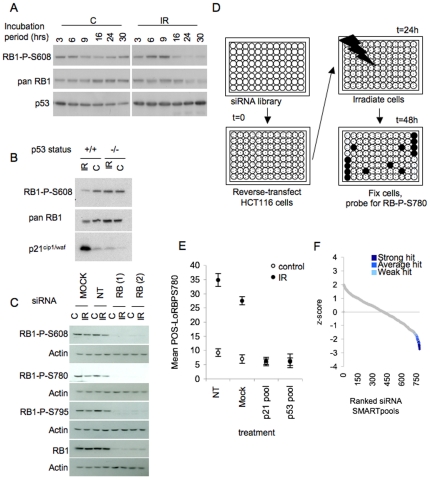
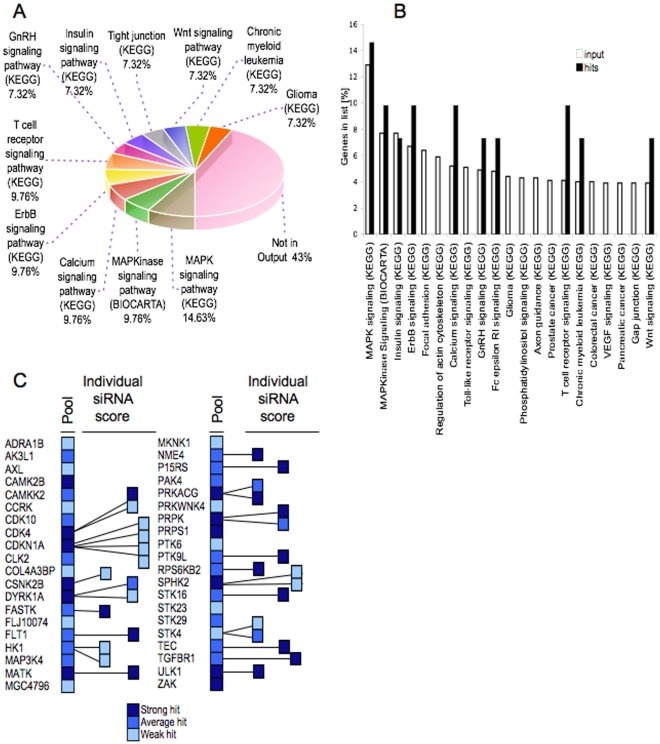
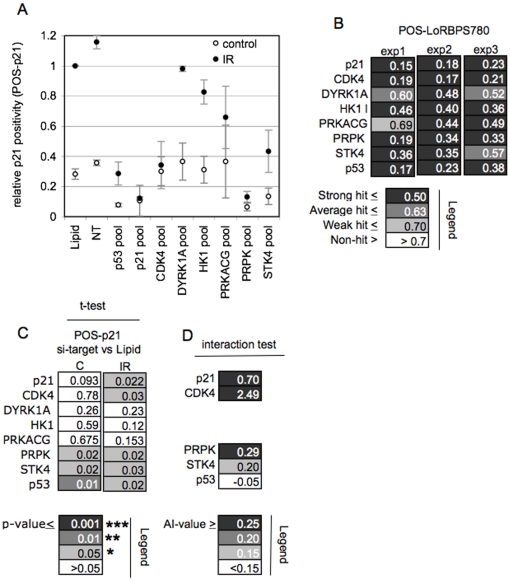
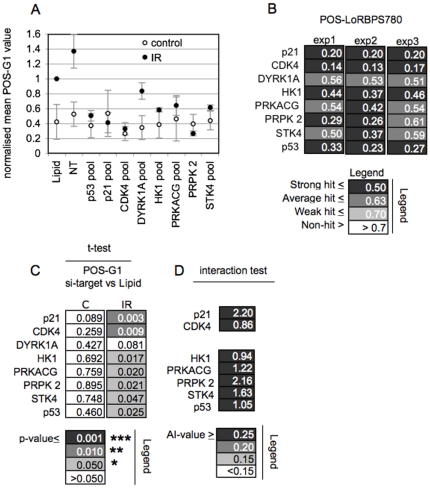
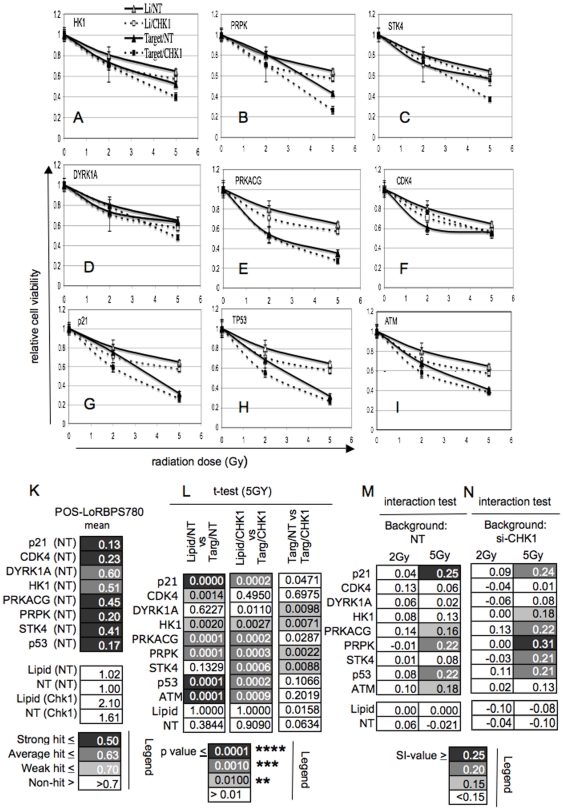
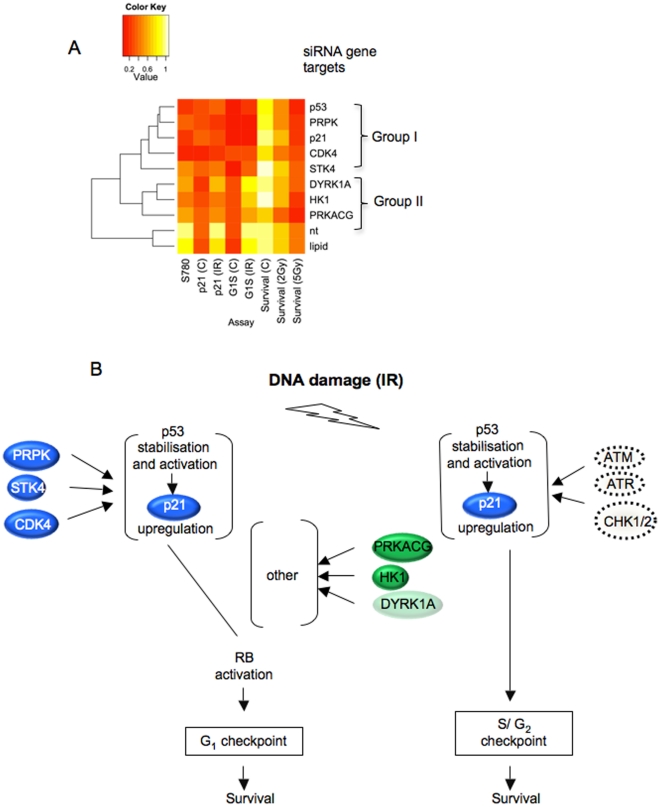
DNA damage activates checkpoint controls which block progression of cells through the division cycle. Several different checkpoints exist that control transit at different positions in the cell cycle. A role for checkpoint activation in providing resistance of cells to genotoxic anticancer therapy, including chemotherapy and ionizing radiation, is widely recognized. Although the core molecular functions that execute different damage activated checkpoints are known, the signals that control checkpoint activation are far from understood. We used a kinome-spanning RNA interference screen to delineate signalling required for radiation-mediated retinoblastoma protein activation, the recognized executor of G(1) checkpoint control. Our results corroborate the involvement of the p53 tumour suppressor (TP53) and its downstream targets p21(CIP1/WAF1) but infer lack of involvement of canonical double strand break (DSB) recognition known for its role in activating TP53 in damaged cells. Instead our results predict signalling involving the known TP53 phosphorylating kinase PRPK/TP53RK and the JNK/p38MAPK activating kinase STK4/MST1, both hitherto unrecognised for their contribution to DNA damage G1 checkpoint signalling. Our results further predict a network topology whereby induction of p21(CIP1/WAF1) is required but not sufficient to elicit checkpoint activation. Our experiments document a role of the kinases identified in radiation protection proposing their pharmacological inhibition as a potential strategy to increase radiation sensitivity in proliferating cancer cells.
Conflict of interest statement
Figures
Similar articles
-
[Cell cycle regulation after exposure to ionizing radiation].Bull Cancer. 1999 Apr;86(4):345-57. Bull Cancer. 1999. PMID: 10341340 Review. French.
-
Down-regulation of nuclear protein ICBP90 by p53/p21Cip1/WAF1-dependent DNA-damage checkpoint signals contributes to cell cycle arrest at G1/S transition.Genes Cells. 2004 Feb;9(2):131-42. doi: 10.1111/j.1356-9597.2004.00710.x. Genes Cells. 2004. PMID: 15009091
-
Nature of G1/S cell cycle checkpoint defect in ataxia-telangiectasia.Oncogene. 1995 Aug 17;11(4):609-18. Oncogene. 1995. PMID: 7651723
-
Chlorpromazine activates p21Waf1/Cip1 gene transcription via early growth response-1 (Egr-1) in C6 glioma cells.Exp Mol Med. 2010 May 31;42(5):395-405. doi: 10.3858/emm.2010.42.5.041. Exp Mol Med. 2010. PMID: 20368687 Free PMC article.
-
ATM: the protein encoded by the gene mutated in the radiosensitive syndrome ataxia-telangiectasia.Int J Radiat Biol. 1999 Oct;75(10):1201-14. doi: 10.1080/095530099139359. Int J Radiat Biol. 1999. PMID: 10549596 Review.
Cited by
-
A novel network analysis approach reveals DNA damage, oxidative stress and calcium/cAMP homeostasis-associated biomarkers in frontotemporal dementia.PLoS One. 2017 Oct 11;12(10):e0185797. doi: 10.1371/journal.pone.0185797. eCollection 2017. PLoS One. 2017. PMID: 29020091 Free PMC article.
-
KinOrtho: a method for mapping human kinase orthologs across the tree of life and illuminating understudied kinases.BMC Bioinformatics. 2021 Sep 18;22(1):446. doi: 10.1186/s12859-021-04358-3. BMC Bioinformatics. 2021. PMID: 34537014 Free PMC article.
-
Direct involvement of retinoblastoma family proteins in DNA repair by non-homologous end-joining.Cell Rep. 2015 Mar 31;10(12):2006-18. doi: 10.1016/j.celrep.2015.02.059. Epub 2015 Mar 26. Cell Rep. 2015. PMID: 25818292 Free PMC article.
-
Targeting PRPK Function Blocks Colon Cancer Metastasis.Mol Cancer Ther. 2018 May;17(5):1101-1113. doi: 10.1158/1535-7163.MCT-17-0628. Epub 2018 Feb 26. Mol Cancer Ther. 2018. PMID: 29483219 Free PMC article.
-
A kinome-targeted RNAi-based screen links FGF signaling to H2AX phosphorylation in response to radiation.Cell Mol Life Sci. 2015 Sep;72(18):3559-73. doi: 10.1007/s00018-015-1901-7. Epub 2015 Apr 18. Cell Mol Life Sci. 2015. PMID: 25894690 Free PMC article.
References
-
- Dahele M, Senan S. Radiation oncology: overview and recent advances. J R Coll Physicians Edinb. 2010;40:136–143; quiz 143–134. - PubMed
-
- Elshaikh M, Ljungman M, Ten Haken R, Lichter AS. Advances in radiation oncology. Annu Rev Med. 2006;57:19–31. - PubMed
-
- Kim JJ, Tannock IF. Repopulation of cancer cells during therapy: an important cause of treatment failure. Nat Rev Cancer. 2005;5:516–525. - PubMed
-
- Lindsay KJ, Coates PJ, Lorimore SA, Wright EG. The genetic basis of tissue responses to ionizing radiation. Br J Radiol 80 Spec No. 2007;1:S2–6. - PubMed
-
- Jorgensen TJ. Enhancing radiosensitivity: targeting the DNA repair pathways. Cancer Biol Ther. 2009;8:665–670. - PubMed
Publication types
MeSH terms
Substances
Grants and funding
LinkOut - more resources
Full Text Sources
Research Materials
Miscellaneous
