

A 24-hour temporal profile of in vivo brain and heart pet imaging reveals a nocturnal peak in brain 18F-fluorodeoxyglucose uptake
- PMID: 22384076
- PMCID: PMC3285174
- DOI: 10.1371/journal.pone.0031792
A 24-hour temporal profile of in vivo brain and heart pet imaging reveals a nocturnal peak in brain 18F-fluorodeoxyglucose uptake
Abstract
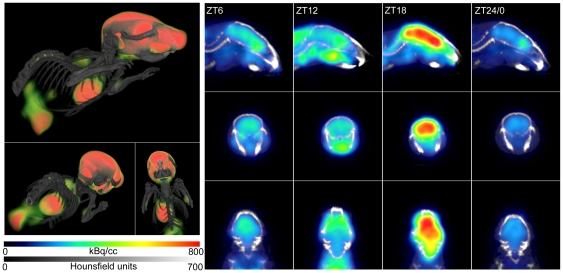
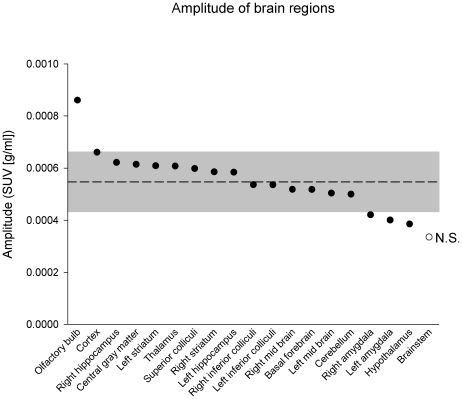
Using positron emission tomography, we measured in vivo uptake of (18)F-fluorodeoxyglucose (FDG) in the brain and heart of C57Bl/6 mice at intervals across a 24-hour light-dark cycle. Our data describe a significant, high amplitude rhythm in FDG uptake throughout the whole brain, peaking at the mid-dark phase of the light-dark cycle, which is the active phase for nocturnal mice. Under these conditions, heart FDG uptake did not vary with time of day, but did show biological variation throughout the 24-hour period for measurements within the same mice. FDG uptake was scanned at different times of day within an individual mouse, and also compared to different times of day between individuals, showing both biological and technical reproducibility of the 24-hour pattern in FDG uptake. Regional analysis of brain FDG uptake revealed especially high amplitude rhythms in the olfactory bulb and cortex, while low amplitude rhythms were observed in the amygdala, brain stem and hypothalamus. Low amplitude 24-hour rhythms in regional FDG uptake may be due to multiple rhythms with different phases in a single brain structure, quenching some of the amplitude. Our data show that the whole brain exhibits significant, high amplitude daily variation in glucose uptake in living mice. Reports applying the 2-deoxy-D[(14)C]-glucose method for the quantitative determination of the rates of local cerebral glucose utilization indicate only a small number of brain regions exhibiting a day versus night variation in glucose utilization. In contrast, our data show 24-hour patterns in glucose uptake in most of the brain regions examined, including several regions that do not show a difference in glucose utilization. Our data also emphasizes a methodological requirement of controlling for the time of day of scanning FDG uptake in the brain in both clinical and pre-clinical settings, and suggests waveform normalization of FDG measurements at different times of the day.
Conflict of interest statement
Figures


References
-
- Hjelstuen OK, Svadberg A, Olberg DE, Rosser M. Standardization of fluorine-18 manufacturing processes: new scientific challenges for PET. Eur J Pharm Biopharm. 2011;78:307–313. - PubMed
-
- Pauwels EK, Ribeiro MJ, Stoot JH, McCready VR, Bourguignon M, et al. FDG accumulation and tumor biology. Nucl Med Biol. 1998;25:317–322. - PubMed
-
- Basu S, Alavi A. Unparalleled contribution of 18F-FDG PET to medicine over 3 decades. J Nucl Med. 2008;49:17N–21N, 37N. - PubMed
-
- Schnockel U, Hermann S, Stegger L, Law M, Kuhlmann M, et al. Small-animal PET: a promising, non-invasive tool in pre-clinical research. Eur J Pharm Biopharm. 2010;74:50–54. - PubMed
Publication types
MeSH terms
Substances
Grants and funding
LinkOut - more resources
Full Text Sources
