

Genetic abolishment of hepatocyte proliferation activates hepatic stem cells
- PMID: 22384083
- PMCID: PMC3285627
- DOI: 10.1371/journal.pone.0031846
Genetic abolishment of hepatocyte proliferation activates hepatic stem cells
Abstract
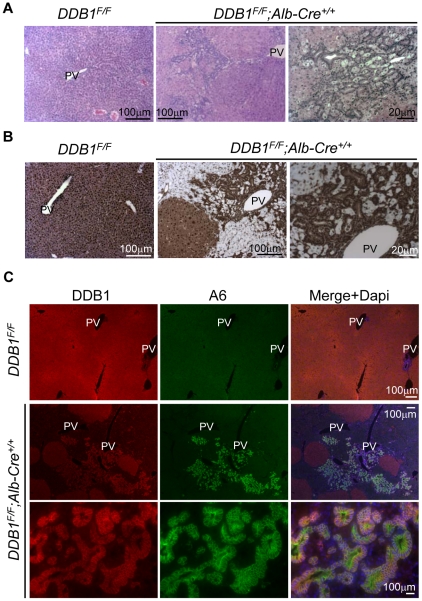
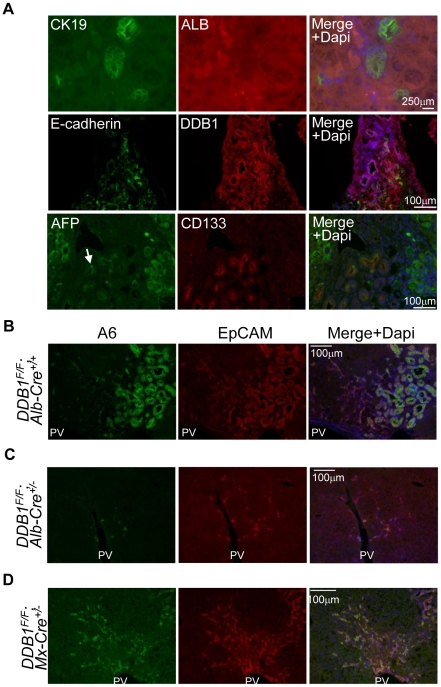
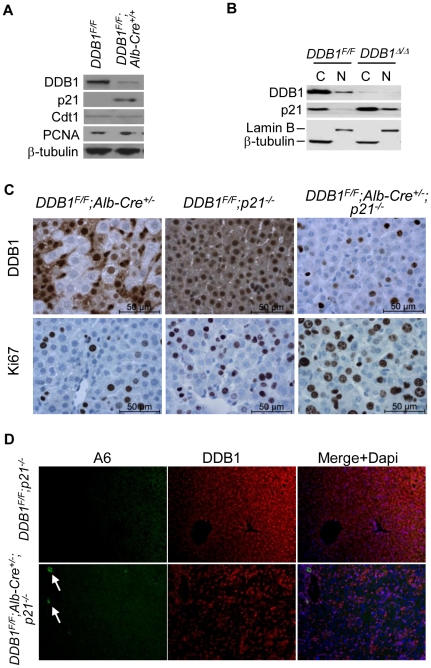
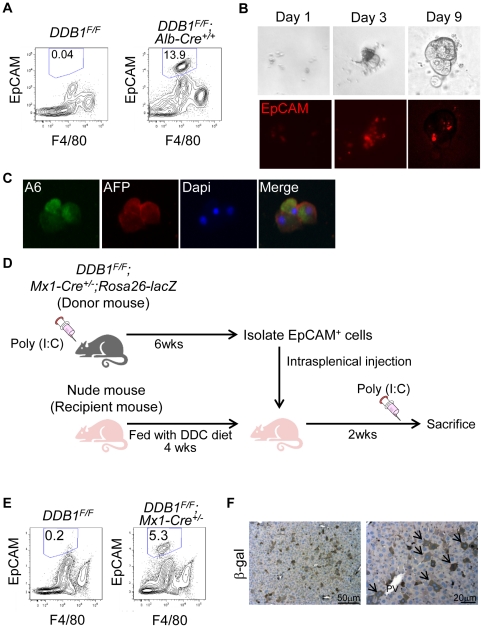
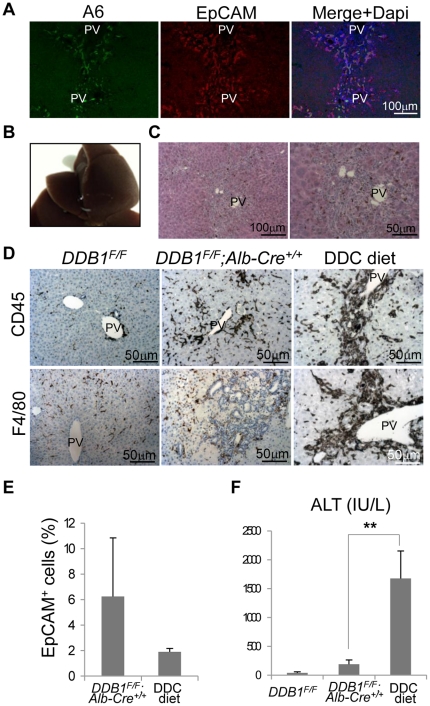
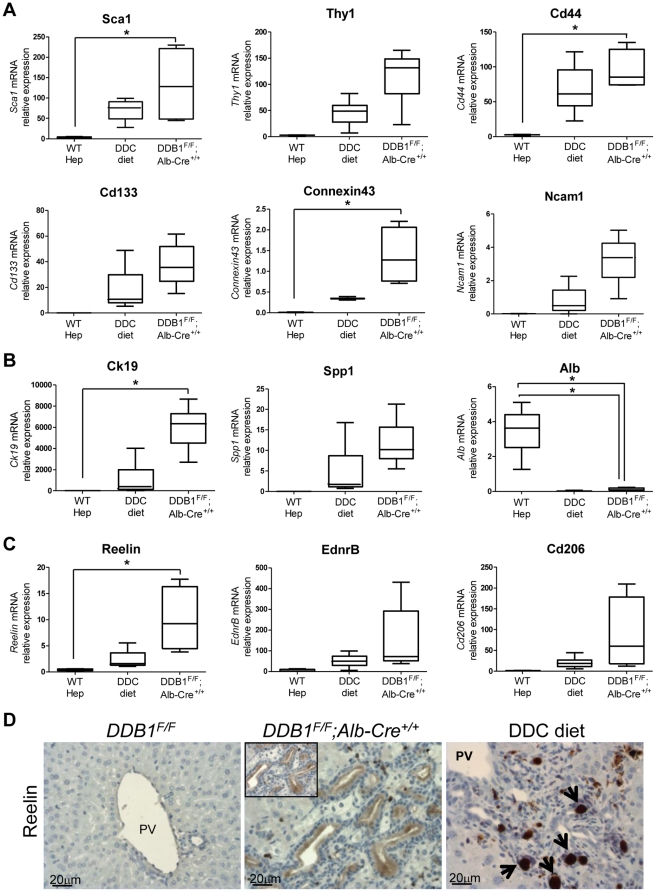
Quiescent hepatic stem cells (HSCs) can be activated when hepatocyte proliferation is compromised. Chemical injury rodent models have been widely used to study the localization, biomarkers, and signaling pathways in HSCs, but these models usually exhibit severe promiscuous toxicity and fail to distinguish damaged and non-damaged cells. Our goal is to establish new animal models to overcome these limitations, thereby providing new insights into HSC biology and application. We generated mutant mice with constitutive or inducible deletion of Damaged DNA Binding protein 1 (DDB1), an E3 ubiquitin ligase, in hepatocytes. We characterized the molecular mechanism underlying the compensatory activation and the properties of oval cells (OCs) by methods of mouse genetics, immuno-staining, cell transplantation and gene expression profiling. We show that deletion of DDB1 abolishes self-renewal capacity of mouse hepatocytes in vivo, leading to compensatory activation and proliferation of DDB1-expressing OCs. Partially restoring proliferation of DDB1-deficient hepatocytes by ablation of p21, a substrate of DDB1 E3 ligase, alleviates OC proliferation. Purified OCs express both hepatocyte and cholangiocyte markers, form colonies in vitro, and differentiate to hepatocytes after transplantation. Importantly, the DDB1 mutant mice exhibit very minor liver damage, compared to a chemical injury model. Microarray analysis reveals several previously unrecognized markers, including Reelin, enriched in oval cells. Here we report a genetic model in which irreversible inhibition of hepatocyte duplication results in HSC-driven liver regeneration. The DDB1 mutant mice can be broadly applied to studies of HSC differentiation, HSC niche and HSCs as origin of liver cancer.
Conflict of interest statement
Figures
Similar articles
-
Potential hepatic stem cells reside in EpCAM+ cells of normal and injured mouse liver.Development. 2009 Jun;136(11):1951-60. doi: 10.1242/dev.031369. Development. 2009. PMID: 19429791
-
Flow cytometric isolation and clonal identification of self-renewing bipotent hepatic progenitor cells in adult mouse liver.Hepatology. 2008 Dec;48(6):1964-78. doi: 10.1002/hep.22558. Hepatology. 2008. PMID: 18837044
-
Fate-mapping evidence that hepatic stellate cells are epithelial progenitors in adult mouse livers.Stem Cells. 2008 Aug;26(8):2104-13. doi: 10.1634/stemcells.2008-0115. Epub 2008 May 29. Stem Cells. 2008. PMID: 18511600 Free PMC article.
-
EpCAM and the biology of hepatic stem/progenitor cells.Am J Physiol Gastrointest Liver Physiol. 2015 Feb 15;308(4):G233-50. doi: 10.1152/ajpgi.00069.2014. Epub 2014 Dec 4. Am J Physiol Gastrointest Liver Physiol. 2015. PMID: 25477371 Free PMC article. Review.
-
Liver progenitor cell-driven liver regeneration.Exp Mol Med. 2020 Aug;52(8):1230-1238. doi: 10.1038/s12276-020-0483-0. Epub 2020 Aug 14. Exp Mol Med. 2020. PMID: 32796957 Free PMC article. Review.
Cited by
-
Stem cells in liver regeneration and their potential clinical applications.Stem Cell Rev Rep. 2013 Oct;9(5):668-84. doi: 10.1007/s12015-013-9437-4. Stem Cell Rev Rep. 2013. PMID: 23526206 Review.
-
Distinct role of interleukin-6 and tumor necrosis factor receptor-1 in oval cell- mediated liver regeneration and inflammation-associated hepatocarcinogenesis.Oncotarget. 2016 Oct 11;7(41):66635-66646. doi: 10.18632/oncotarget.11365. Oncotarget. 2016. PMID: 27556180 Free PMC article.
-
A novel role of nucleostemin in maintaining the genome integrity of dividing hepatocytes during mouse liver development and regeneration.Hepatology. 2013 Dec;58(6):2176-87. doi: 10.1002/hep.26600. Epub 2013 Oct 21. Hepatology. 2013. PMID: 23813570 Free PMC article.
-
Bone marrow injection stimulates hepatic ductular reactions in the absence of injury via macrophage-mediated TWEAK signaling.Proc Natl Acad Sci U S A. 2013 Apr 16;110(16):6542-7. doi: 10.1073/pnas.1302168110. Epub 2013 Apr 1. Proc Natl Acad Sci U S A. 2013. PMID: 23576749 Free PMC article.
-
The origin, biology, and therapeutic potential of facultative adult hepatic progenitor cells.Curr Top Dev Biol. 2014;107:269-92. doi: 10.1016/B978-0-12-416022-4.00010-X. Curr Top Dev Biol. 2014. PMID: 24439810 Free PMC article. Review.
References
-
- Slack JM. Origin of stem cells in organogenesis. Science. 2008;322:1498–1501. - PubMed
-
- Michalopoulos GK, DeFrances MC. Liver regeneration. Science. 1997;276:60–66. - PubMed
-
- Taub R. Liver regeneration: from myth to mechanism. Nat Rev Mol Cell Biol. 2004;5:836–847. - PubMed
-
- Fausto N, Campbell JS, Riehle KJ. Liver regeneration. Hepatology. 2006;43:S45–53. - PubMed
Publication types
MeSH terms
Substances
LinkOut - more resources
Full Text Sources
Medical
Molecular Biology Databases
Research Materials
