Comparative Study
. 2012;7(2):e31847.
doi: 10.1371/journal.pone.0031847. Epub 2012 Feb 27.

Comparative gene expression profiling of P. falciparum malaria parasites exposed to three different histone deacetylase inhibitors

Affiliations
Comparative Study

Comparative gene expression profiling of P. falciparum malaria parasites exposed to three different histone deacetylase inhibitors

Katherine T Andrews et al. PLoS One. 2012.

Abstract

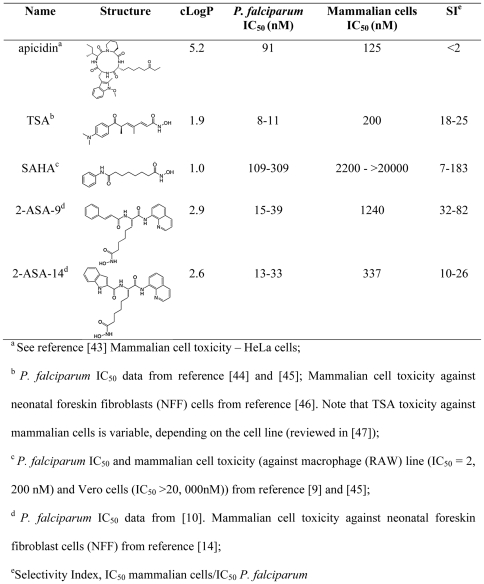
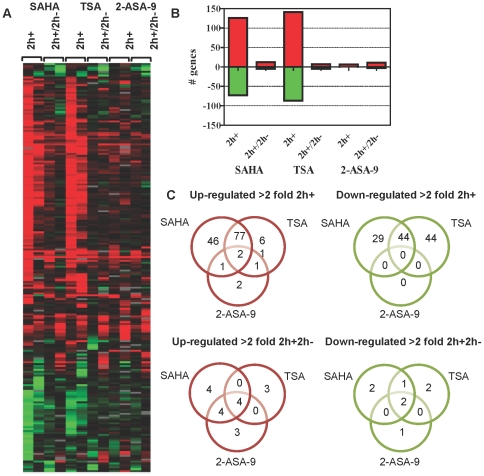
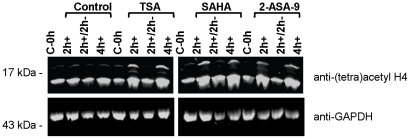
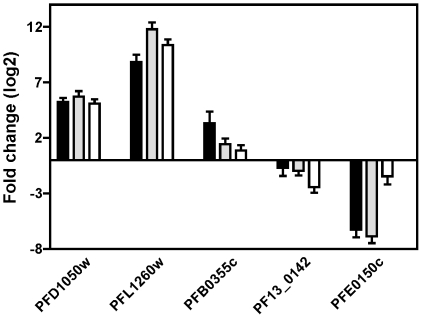
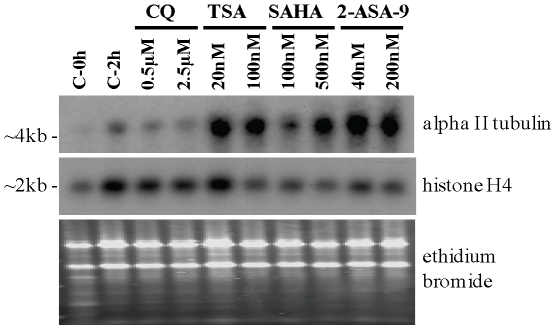
Histone deacetylase (HDAC) inhibitors are being intensively pursued as potential new drugs for a range of diseases, including malaria. HDAC inhibitors are also important tools for the study of epigenetic mechanisms, transcriptional control, and other important cellular processes. In this study the effects of three structurally related antimalarial HDAC inhibitors on P. falciparum malaria parasite gene expression were compared. The three hydroxamate-based compounds, trichostatin A (TSA), suberoylanilide hydroxamic acid (SAHA; Vorinostat®) and a 2-aminosuberic acid derivative (2-ASA-9), all caused profound transcriptional effects, with ~2-21% of genes having >2-fold altered expression following 2 h exposure to the compounds. Only two genes, alpha tubulin II and a hydrolase, were up-regulated by all three compounds after 2 h exposure in all biological replicates examined. The transcriptional changes observed after 2 h exposure to HDAC inhibitors were found to be largely transitory, with only 1-5% of genes being regulated after removing the compounds and culturing for a further 2 h. Despite some structural similarity, the three inhibitors caused quite diverse transcriptional effects, possibly reflecting subtle differences in mode of action or cellular distribution. This dataset represents an important contribution to our understanding of how HDAC inhibitors act on malaria parasites and identifies alpha tubulin II as a potential transcriptional marker of HDAC inhibition in malaria parasites that may be able to be exploited for future development of HDAC inhibitors as new antimalarial agents.


Conflict of interest statement

Competing Interests: The authors have declared that no competing interests exist.

Figures

Figure 1
Figure 1. In vitro profile of different HDAC inhibitors.
Figure 2
Figure 2. Global transcriptional response of P. falciparum to hydroxamate-based HDAC inhibitors.
Synchronous 3D7 trophozoite-stage parasites were treated with DMSO (0.05%) or IC90 amounts of SAHA, TSA, or 2-ASA-9. RNA was collected from parasites after treatment for 2 h (2 h+), or after 2 h, washing, and culture for a further 2 h (2 h+/2 h−). cDNA was synthesized from RNA and labelled with Cy5 and hybridized against Cy3 labelled 3D7 reference pool. Microarray data, including mRNA abundance ratios between each sample and the 3D7 reference pool, was filtered as described in material and methods. Data shown are genes with >2 fold differential expression induced by the compounds. Heat map showing up- (red), down- (green) regulated or relatively unchanged (black) genes, for two independent biological replicates for each compound (A). The total number of genes with altered expression is shown graphically (B) and genes commonly or uniquely regulated in 2 h+ or 2 h+2 h− parasites are shown in Venn diagrams (C). For (B) and (C) data are the combined replicates for each compound to show genes commonly up- or down-regulated for each compound and treatment time. For example, 127 genes were up-regulated in common between both biological replicates for parasites treated with SAHA for 2 h (B).
Figure 3
Figure 3. Histone H4 hyperacetylation assay.
P. falciparum 3D7 infected erythrocytes were cultured in vitro with IC90 concentrations of TSA, SAHA or 2-ASA-9 for 2 h (2 h+), for 2 h followed by washing and culture for a further 2 h (2 h+/2 h−), or for 4 h (4 h+). Matched control cultures, including a control taken at the start of the experiment (C-0 h) received vehicle only. Parasite protein lysates were prepared and separated via SDS-PAGE, followed by Western blot analysis using anti-(tetra) acetyl histone H4 or anti-GAPDH antisera as a loading control.
Figure 4
Figure 4. Validation of up- and down-regulated gene expression by quantitative PCR.
Quantitative RT-PCR was carried out on five genes using RNA obtained from cells treated with DMSO or compound for 2 h (2 h+). PFD1050w (alpha tubulin II) and PFL1260w (putative hydrolase/phosphatase) were up-regulated in both biological replicates for each compound in microarray analyses; PFB0355c (SERA2) was up-regulated in at least one biological replicate for each compound; and PF13_0142 (a putative spliceosome component) and PFE0150c (a putative kinase) were both down regulated at least one replicate for TSA and SAHA, but not regulated by 2-ASA-9. Relative fold change in expression levels were calculated using 2−ΔΔCt method where histone H4 gene was used as internal control.
Figure 5
Figure 5. Effect of HDAC inhibitor treatment on transcription of P. falciparum alpha tubulin II and histone H4 genes.
Synchronous trophozoite-stage K1 P. falciparum infected erythrocytes were treated with ∼1×IC50 or ∼5×IC50 concentrations of chloroquine (0.5 and 2.5 µM), TSA (20 and 100 nM), SAHA (100 and 500 nM), or 2-ASA-9 (40 and 200 nM) for 2 hours. Matched controls taken at 0 h and 2 h (C-0 h and C-2 h, respectively) were treated with 0.05% dimethyl sulfoxide (DMSO). Total RNA was prepared and separated via electrophoresis on an 1.0% agarose gel, followed by transfer and crosslinking to nitrocellulose membrane. The membrane was probed with 32P-labeled alpha tubulin II purified PCR product, then stripped and re-probed with 32P-labeled histone H4 gel purified PCR product. The histone H4 transcript and ethidium bromide-stained agarose gel is shown to indicate RNA loading levels.

Similar articles

Cited by

References

    1. Andrews KT, Tran TN, Wheatley NC, Fairlie DP. Targeting histone deacetylase inhibitors for anti-malarial therapy. Curr Top Med Chem. 2009;9:292–308. - PubMed
    1. Garcia-Estrada C, Prada CF, Fernandez-Rubio C, Rojo-Vazquez F, Balana-Fouce R. DNA topoisomerases in apicomplexan parasites: promising targets for drug discovery. Proc Biol Sci. 2010;277:1777–1787. - PMC - PubMed
    1. Andrews KT, Haque A, Jones MK. HDAC inhibitors in parasitic diseases. Immunol Cell Biol. 2012;90:66–77. - PubMed
    1. Freitas-Junior LH, Hernandez-Rivas R, Ralph SA, Montiel-Condado D, Ruvalcaba-Salazar OK, et al. Telomeric heterochromatin propagation and histone acetylation control mutually exclusive expression of antigenic variation genes in malaria parasites. Cell. 2005;121:25–36. - PubMed
    1. Duraisingh MT, Voss TS, Marty AJ, Duffy MF, Good RT, et al. Heterochromatin silencing and locus repositioning linked to regulation of virulence genes in Plasmodium falciparum. Cell. 2005;121:13–24. - PubMed

Publication types

MeSH terms