. 2012;7(2):e31881.
doi: 10.1371/journal.pone.0031881. Epub 2012 Feb 23.

In vivo fluorescence lifetime imaging monitors binding of specific probes to cancer biomarkers

Affiliations

In vivo fluorescence lifetime imaging monitors binding of specific probes to cancer biomarkers

Yasaman Ardeshirpour et al. PLoS One. 2012.

Abstract

One of the most important factors in choosing a treatment strategy for cancer is characterization of biomarkers in cancer cells. Particularly, recent advances in Monoclonal Antibodies (MAB) as primary-specific drugs targeting tumor receptors show that their efficacy depends strongly on characterization of tumor biomarkers. Assessment of their status in individual patients would facilitate selection of an optimal treatment strategy, and the continuous monitoring of those biomarkers and their binding process to the therapy would provide a means for early evaluation of the efficacy of therapeutic intervention. In this study we have demonstrated for the first time in live animals that the fluorescence lifetime can be used to detect the binding of targeted optical probes to the extracellular receptors on tumor cells in vivo. The rationale was that fluorescence lifetime of a specific probe is sensitive to local environment and/or affinity to other molecules. We attached Near-InfraRed (NIR) fluorescent probes to Human Epidermal Growth Factor 2 (HER2/neu)-specific Affibody molecules and used our time-resolved optical system to compare the fluorescence lifetime of the optical probes that were bound and unbound to tumor cells in live mice. Our results show that the fluorescence lifetime changes in our model system delineate HER2 receptor bound from the unbound probe in vivo. Thus, this method is useful as a specific marker of the receptor binding process, which can open a new paradigm in the "image and treat" concept, especially for early evaluation of the efficacy of the therapy.


Conflict of interest statement

Competing Interests: The authors have declared that no competing interests exist.

Figures

Figure 1
Figure 1. Effect of (A) pH and (B) BSA concentration on the lifetime of DyLight750 conjugated to HER2 specific Affibody probe.
Figure 2
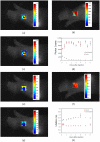
Figure 2. In vivo fluorescence imaging of xenograft mouse with high HER2 expressing human tumor model (BT-474) after injection of HER2-specific Affibody® (His6-ZHER2:GS-Cys) conjugated to Dylight750.
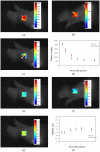
(A) Fluorescence intensity map at the tumor region. (B)Fluorescence intensity map at the contralateral site (C) The difference of fluorescence intensity at the tumor region and the contralateral site, mapped on the tumor region. (D) Pharmacokinetics of the fluorescence intensity at the tumor region and contralateral site after the injection over time. The fluorescent intensity was averaged over 16 pixels at the contralateral site. The data in Figs. (D) and (H) are the average data of four mice. Markers show the average and bars show the standard deviation. (E) Fluorescence lifetime map at the tumor region. (F) Fluorescence lifetime map at the contralateral site. (G) The difference of fluorescence lifetime at the tumor and the contralateral site mapped on the tumor region. (E)Pharmacokinetics of the fluorescent lifetime at the tumor region and contralateral site after injection over time. All lifetime and fluorescence intensity maps in figures 2,4– 7 are from measurements at 1 hour after the injection of Affibody probe. In all measurements, the photons were counted over two seconds integration time, t0. To exclude saturation effect of the 16 bit camera, in the brightest pixels, where the corresponding limit of 65536 counts was reached before time t0, we have renormalized the data by multiplying photon counts, measured for lower integration time t, by factor t0/t.
Figure 3
Figure 3. An example of fitting results obtained by SPCImage software, (ver. 3.2, Becker & Hickl GmbH) for measurements at the tumor (A) and contralateral (B) sites, 1 hour after injection of HER2-specific Affibody conjugated to Dylight750 in a mouse with high HER2 expressing human tumor model (BT-474).
X axis is the amplitude and y axis is the measurement time (ns). Blue and green graphs show the measurement data and impulse response function of the system, respectively. The fitting was based on single exponential decay model. Parameter a1 shows the relative of amplitude in single exponential decay model and t1 is the lifetime (in picoseconds). The small graph at the bottom is the fitting error and the red line shows the fitted curve.
Figure 4
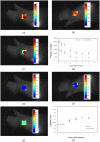
Figure 4. In vivo fluorescence imaging of xenograft mouse with high HER2 expressing human tumor model (BT-474) after injection of HER2-nonspecific Affibody® (His6-ZTaq:GS-Cys) conjugated to Dylight750.
(A) Fluorescence intensity map at the tumor region. (B)Fluorescence intensity map at the contralateral site (C) The difference of fluorescence intensity at the tumor region and the contralateral site, mapped on the tumor region. (D) Pharmacokinetics of the fluorescence intensity at the tumor region and contralateral site after the injection over time. The data in Figs. (D) and (H) are the average data of three mice. Markers show the average and bars show the standard deviation. (Erpar; Fluorescence lifetime map at the tumor region. (F) Fluorescence lifetime map at the contralateral site. (G) The difference of fluorescent lifetime at the tumor region and the contralateral site mapped on the tumor region. (E) Pharmacokinetics of the fluorescent lifetime at the tumor region and contralateral site after injection over time.
Figure 5
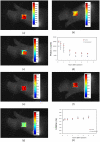
Figure 5. In vivo fluorescence imaging of xenograft mouse with no HER2 expressing human tumor model (MDA-MB-468) after injection of the HER2-specific Affibody® (His6-ZHER2:GS-Cys) conjugated to Dylight750.
(A) Fluorescence intensity map at the tumor region. (B) Fluorescence intensity map at the contralateral site. (C) The difference of fluorescence intensity at the tumor region and the contralateral site, mapped on the tumor region. (D) Pharmacokinetics of the fluorescence intensity at the tumor region and contralateral site after the injection over time. The data in Figs. (D) and (H) are the average data of three mice. Markers show the average and bars show the standard deviation. (E)Fluorescence lifetime map at the tumor region. (F) Fluorescence lifetime map at the contralateral site. (G) The difference of fluorescent lifetime at the tumor and the contralateral site mapped on the tumor region. (E) Pharmacokinetics of the fluorescent lifetime at the tumor region and contralateral site after injection over time.
Figure 6
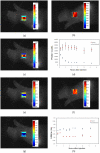
Figure 6. In vivo fluorescence imaging of xenograft mouse with high HER2-expressing human tumor model (NCI-N87) after injection of the HER2 specific Affibody® (His6-ZHER2:GS-Cys) conjugated to Dylight750.
(A) Fluorescence intensity map at the tumor region. (B)Fluorescence intensity map at the contralateral site. (C) The difference of fluorescence intensity at the tumor region and the contralateral site, mapped on the tumor region. (D) Pharmacokinetics of the fluorescence intensity at the tumor region and contralateral site after the injection over time. The data in Figs. (D) and (H) are the average data of three mice. Markers show the average and bars show the standard deviation. (E)Fluorescence lifetime map at the tumor region. (F) Fluorescence lifetime map at the contralateral site. (G) The difference of fluorescent lifetime at the tumor and the contralateral site mapped on the tumor region. (E) Pharmacokinetics of the fluorescent lifetime at the tumor region and contralateral site after injection over time.
Figure 7
Figure 7. In vivo fluorescence imaging of xenograft mouse with high HER2 expressing human tumor model (NCI-N87) after injection of the HER2-nonspecific Affibody® (His6-ZTaq:GS-Cys) conjugated to Dylight750.
(A) Fluorescence intensity map at the tumor region. (B)Fluorescence intensity map at the contralateral site (C) The difference of fluorescence intensity at the tumor region and the contralateral site, mapped on the tumor region. (D) Pharmacokinetics of the fluorescence intensity at the tumor region and contralateral site after the injection over time. The data in Figs. (D) and (H) are the average data of three mice. Markers show the average and bars show the standard deviation. (E)Fluorescence lifetime map at the tumor region. (F) Fluorescence lifetime map at the contralateral site. (G) The difference of fluorescent lifetime at the tumor and the contralateral site mapped on the tumor region. (E) Pharmacokinetics of the fluorescent lifetime at the tumor region and contralateral site after injection over time.
Figure 8
Figure 8. Comparison of autofluorescence intensity at the tumor and contralateral sites.
The autofluorescence intensity map at the (A) tumor and (B) contralateral sites before injection. Comparison of the autofluorescence intensity before injection and the fluorescence signal after injection of (C) HER2 specific Affibody-Dylight750 and (D) HER2 non-specific Affibody-Dylight750 in 3 mice with HER2 positive tumor (NCI-N87 tumor carcinoma) at the tumor and contralateral sites .
Figure 9
Figure 9. Histological (IHC) images of tumor tissues for tumor with no HER2 expression (A–B) MDA-MB-468, and highly expressed HER2 tumor (C–D) BT-474 and (E–F) NCI-N87.
Tumor tissue was extracted from animals 24 hours post HER2-Affibody-DyLight750 injection, fixed in 10%NBF and analyzed by IHC for detection of HER2 status (A,C and E) and Affibody presence (B,D and F).
Figure 10
Figure 10. Confocal microscopy of HER2 positive (A) and negative (B) cells exposed to HER2-Affibody-DyLight488.
Blue color shows the cell nuclei labeled with Hoechst 33342 and green color shows the HER2-Affibody-DyLight 488.
Figure 11
Figure 11. In-vitro image of HER2 positive cancer cells (SKBR3) exposed to HER2-Affibody-Dylight750 in (A–C) PBS and (D–F) cell culture with 10% FBS.
Figures (A) and (D) show the intensity and (B) and (E) show the lifetime image. The histogram of the lifetime distribution has been shown in figures (C) and (F) for PBS and 10% FBS in cell culture media, respectively.

Similar articles

Cited by

References

    1. Allison M. The HER2 testing conundrum. Nature Biotechnology. 2010;28:117–119. - PubMed
    1. Nutt R, Vento LJ, Ridinger MH. In vivo molecular imaging biomarkers: clinical pharmacology's new “PET”? Clin Pharmacol Ther. 2007;81:792–795. - PubMed
    1. Bremer C, Ntziachristos V, Weissleder R. Optical-based molecular imaging: contrast agents and potential medical applications. Eur Radiol. 2003;13:231–243. - PubMed
    1. Ardeshirpour Y, Chernomordik V, Capala J, Hassan M, Zielinsky R, et al. Using in-vivo fluorescence imaging in personalized cancer diagnostics andtherapy, an image and treat paradigm. Technol Cancer Res Treat. 2011;10:549–60. - PMC - PubMed
    1. Corlu A, Choe R, Durduran T, Rosen MA, Schweiger M, et al. Three-dimensional in vivo fluorescence diffuse optical tomography of breast cancer in humans. Opt Express. 2007;15:6696–6716. - PubMed

Publication types