

Acute response of peripheral blood cell to autologous hematopoietic stem cell transplantation in type 1 diabetic patient
- PMID: 22384093
- PMCID: PMC3285188
- DOI: 10.1371/journal.pone.0031887
Acute response of peripheral blood cell to autologous hematopoietic stem cell transplantation in type 1 diabetic patient
Abstract
Objective: Autologous nonmyeloablative hematopoietic stem cell transplantation (AHST) was the first therapeutic approach that can improve β cell function in type 1 diabetic (T1D) patients. This study was designed to investigate the potential mechanisms involved.
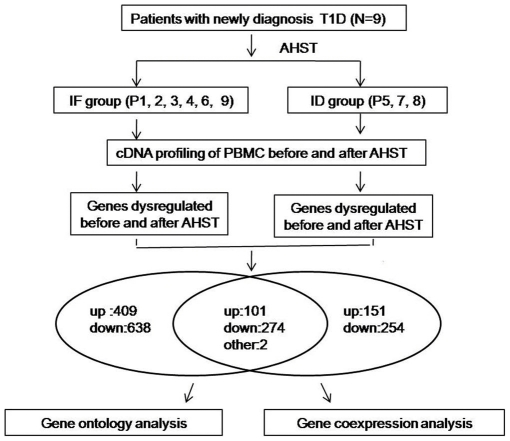
Design and methods: We applied AHST to nine T1D patients diagnosed within six months and analyzed the acute responses in peripheral blood for lymphocyte subpopulation as well as for genomic expression profiling at the six-month follow-up.
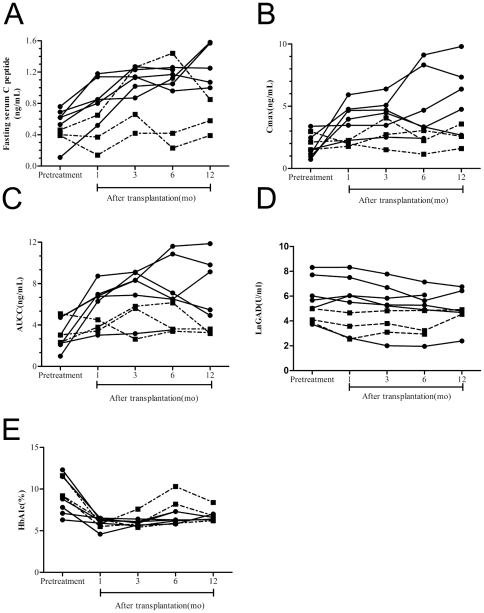
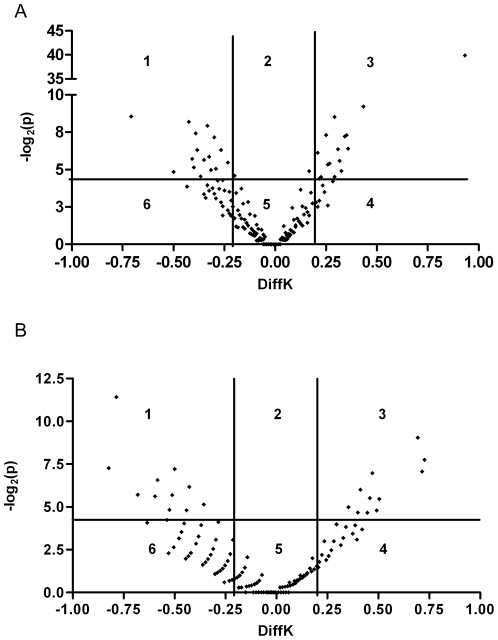
Results: We found six patients obtained insulin free (IF group) and three remained insulin dependent (ID group); C-peptide production was significantly higher in IF group compared to ID group. The acute responses in lymphocytes at six-month follow-up include declined CD3(+)CD4(+), CD3(+)CD8(+) T cell population and recovered B cell, NK cell population in both groups but with no significant differences between the two groups; most immune-related genes and pathways were up-regulated in peripheral blood mononuclear cell (PBMC) of both groups while none of transcription factors for immune regulatory component were significantly changed; the IF group demonstrated more AHST-modified genetic events than the ID group and distinct pattern of top pathways, co-expression network as well as 'hub' genes (eg, TCF7 and GZMA) were associated with each group.
Conclusions: AHST could improve the islet function in newly diagnosed T1D patients and elimination of the islet specific autoreactive T cells might be one of the mechanisms involved; T1D patients responded differently to AHST possibly due to the distinct transcriptional events occurring in PBMC.
Trial registration: ClinicalTrials.gov NCT00807651.
Conflict of interest statement
Figures
Similar articles
-
Autologous nonmyeloablative hematopoietic stem cell transplantation in newly diagnosed type 1 diabetes mellitus.JAMA. 2007 Apr 11;297(14):1568-76. doi: 10.1001/jama.297.14.1568. JAMA. 2007. PMID: 17426276 Clinical Trial.
-
Autologous hematopoietic stem cell transplantation and conventional insulin therapy in the treatment of children with newly diagnosed type 1 diabetes: long term follow-up.Chin Med J (Engl). 2014;127(14):2618-22. Chin Med J (Engl). 2014. PMID: 25043077
-
Development of type 1 diabetes mellitus in nonobese diabetic mice follows changes in thymocyte and peripheral T lymphocyte transcriptional activity.Clin Dev Immunol. 2011;2011:158735. doi: 10.1155/2011/158735. Epub 2011 Jun 15. Clin Dev Immunol. 2011. PMID: 21765850 Free PMC article.
-
Immunological applications of stem cells in type 1 diabetes.Endocr Rev. 2011 Dec;32(6):725-54. doi: 10.1210/er.2011-0008. Epub 2011 Aug 23. Endocr Rev. 2011. PMID: 21862682 Free PMC article. Review.
-
Human Hematopoietic Stem/Progenitor Cells in Type One Diabetes Mellitus Treatment: Is There an Ideal Candidate?Cells. 2023 Mar 30;12(7):1054. doi: 10.3390/cells12071054. Cells. 2023. PMID: 37048127 Free PMC article. Review.
Cited by
-
Investigating the safety and efficacy of hematopoietic and mesenchymal stem cell transplantation for treatment of T1DM: a systematic review and meta-analysis.Syst Rev. 2022 May 2;11(1):82. doi: 10.1186/s13643-022-01950-3. Syst Rev. 2022. PMID: 35501872 Free PMC article.
-
T-cell Recovery After Autologous Hematopoietic Stem Cell Transplantation in Autoimmune Diseases.Adv Exp Med Biol. 2025;1471:301-323. doi: 10.1007/978-3-031-77921-3_12. Adv Exp Med Biol. 2025. PMID: 40067593 Review.
-
The Clinical Efficacy and Safety of Stem Cell Therapy for Diabetes Mellitus: A Systematic Review and Meta-Analysis.Aging Dis. 2020 Feb 1;11(1):141-153. doi: 10.14336/AD.2019.0421. eCollection 2020 Feb. Aging Dis. 2020. PMID: 32010488 Free PMC article. Review.
-
Combination Immunotherapy for Type 1 Diabetes.Curr Diab Rep. 2017 Jul;17(7):50. doi: 10.1007/s11892-017-0878-z. Curr Diab Rep. 2017. PMID: 28534310 Free PMC article. Review.
-
Stem cell therapy for patients with diabetes: a systematic review and meta-analysis of metabolomics-based risks and benefits.Stem Cell Investig. 2018 Nov 14;5:40. doi: 10.21037/sci.2018.11.01. eCollection 2018. Stem Cell Investig. 2018. PMID: 30596080 Free PMC article.
References
-
- American Diabetes Association. Diagnosis and classification of diabetes. Diabetes Care. 2004;27(suppl I):S5–S10. - PubMed
-
- Lehuen Agnès, Diana Julien, Zaccone Paola, Cooke Anne. Immune cell crosstalk in type 1 diabetes. Nature Reviews Immunology. 2010;10:501–5133. - PubMed
-
- The Diabetes Control and Complications Trial Research Group. The effect of intensive treatment of diabetes on the development and progression of long term complications in insulin-dependent diabetes mellitus. N Engl J Med. 1993;329:977–98. - PubMed
-
- Chatenoud L. CD3-specific antibody-induced active tolerance: From bench to bedside. Nat. Rev. Immunol. 2003;3:123–132. - PubMed
Publication types
MeSH terms
Substances
Associated data
LinkOut - more resources
Full Text Sources
Other Literature Sources
Medical
Molecular Biology Databases
Research Materials
Miscellaneous
