

Intracellular alkalinization induces cytosolic Ca2+ increases by inhibiting sarco/endoplasmic reticulum Ca2+-ATPase (SERCA)
- PMID: 22384096
- PMCID: PMC3288054
- DOI: 10.1371/journal.pone.0031905
Intracellular alkalinization induces cytosolic Ca2+ increases by inhibiting sarco/endoplasmic reticulum Ca2+-ATPase (SERCA)
Abstract
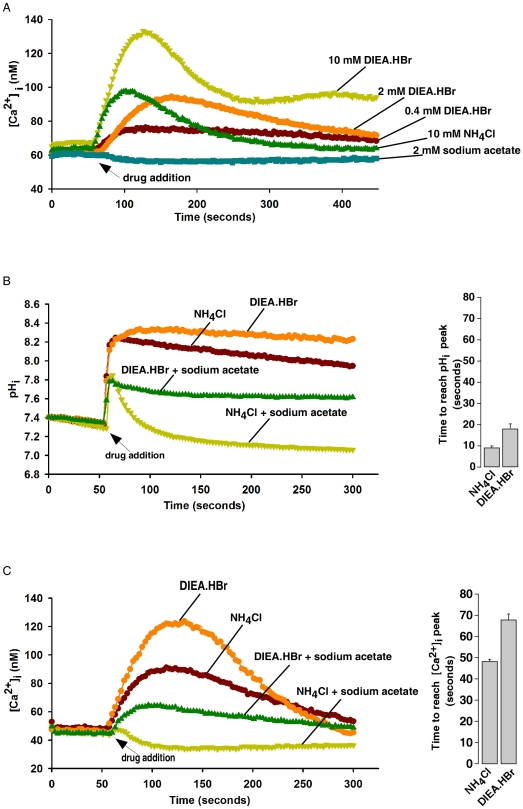
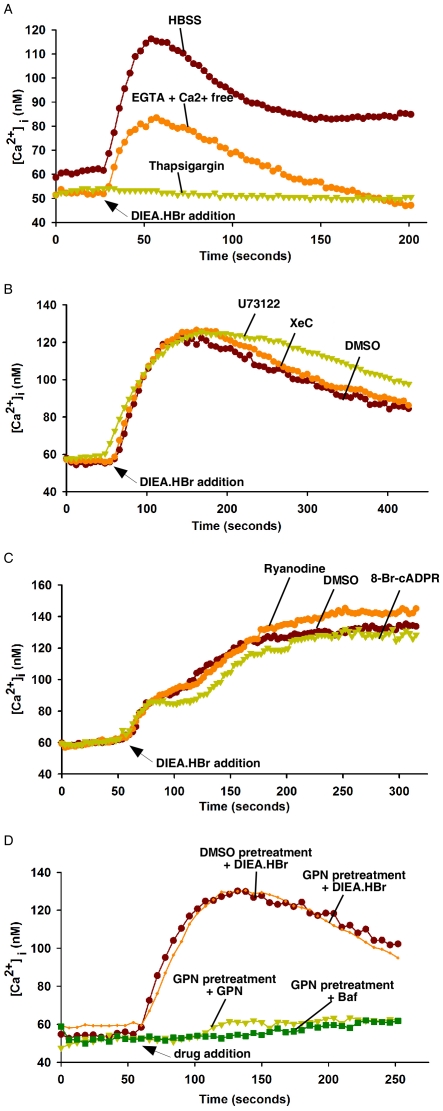
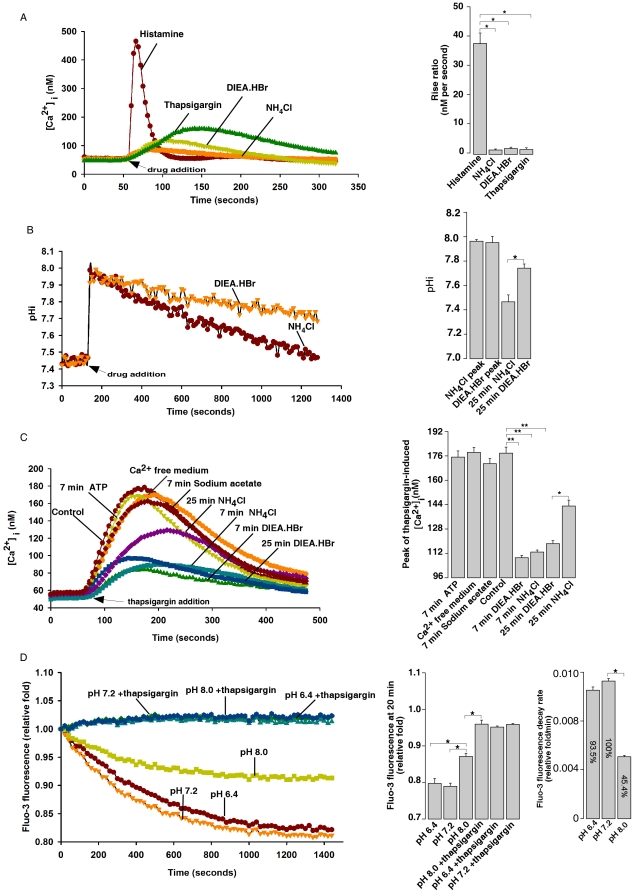
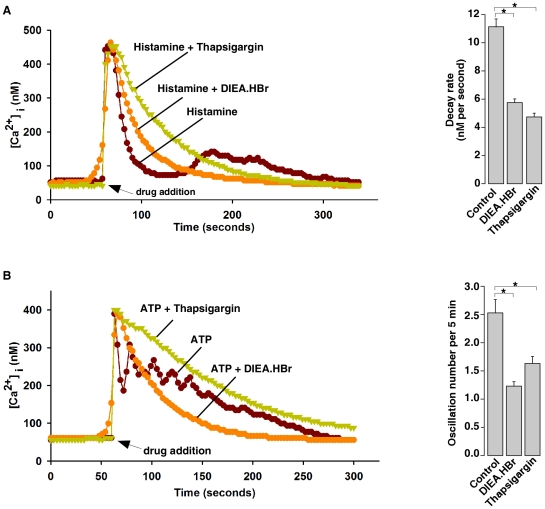
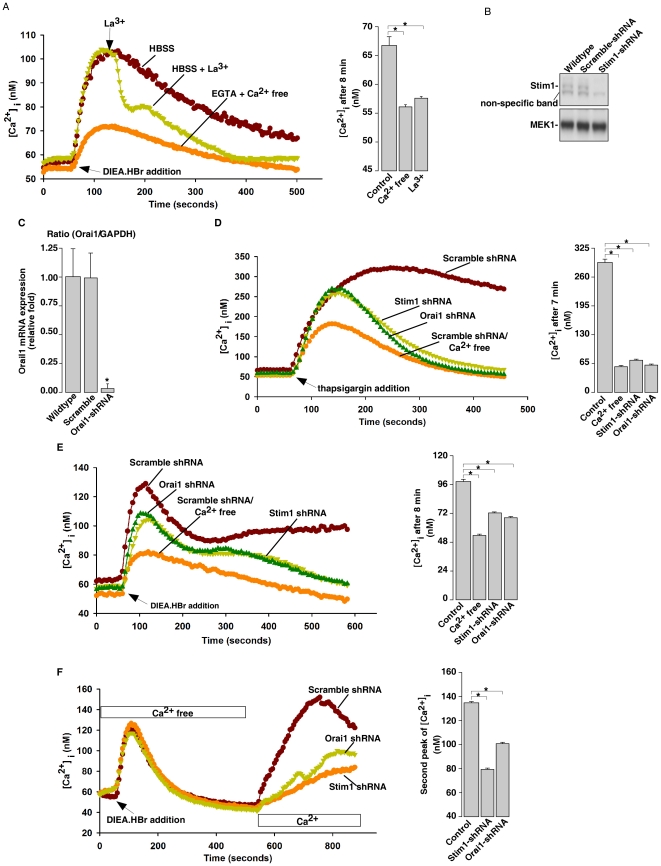
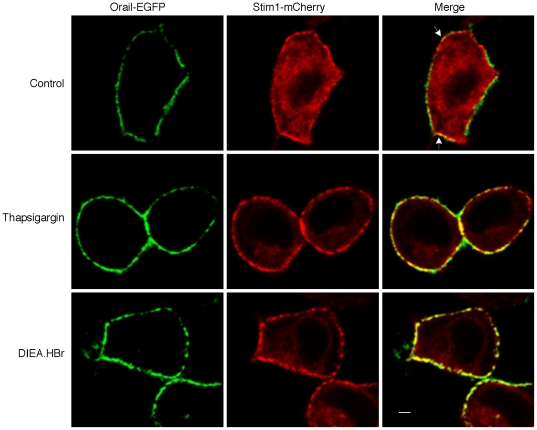
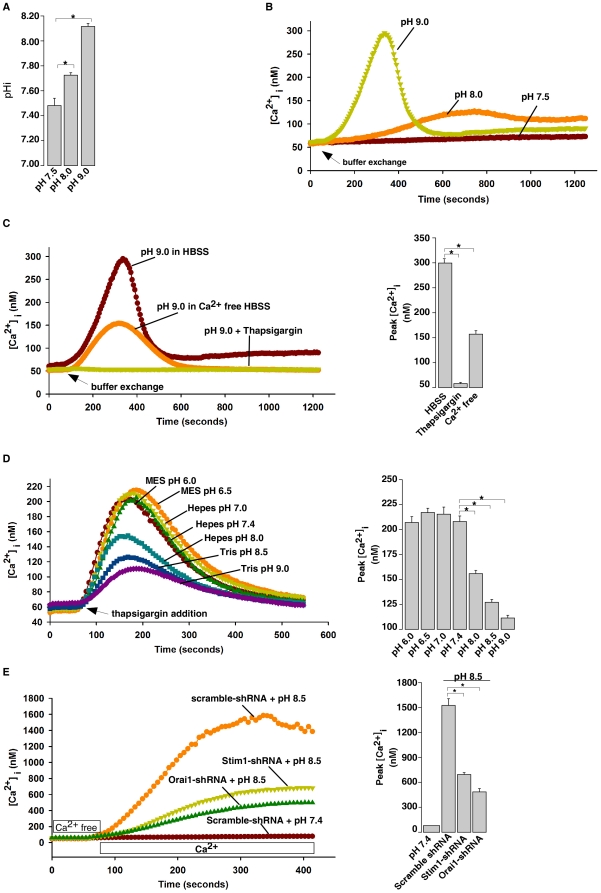
Intracellular pH (pHi) and Ca(2+) regulate essentially all aspects of cellular activities. Their inter-relationship has not been mechanistically explored. In this study, we used bases and acetic acid to manipulate the pHi. We found that transient pHi rise induced by both organic and inorganic bases, but not acidification induced by acid, produced elevation of cytosolic Ca(2+). The sources of the Ca(2+) increase are from the endoplasmic reticulum (ER) Ca(2+) pools as well as from Ca(2+) influx. The store-mobilization component of the Ca(2+) increase induced by the pHi rise was not sensitive to antagonists for either IP(3)-receptors or ryanodine receptors, but was due to inhibition of the sarco/endoplasmic reticulum Ca(2+)-ATPase (SERCA), leading to depletion of the ER Ca(2+) store. We further showed that the physiological consequence of depletion of the ER Ca(2+) store by pHi rise is the activation of store-operated channels (SOCs) of Orai1 and Stim1, leading to increased Ca(2+) influx. Taken together, our results indicate that intracellular alkalinization inhibits SERCA activity, similar to thapsigargin, thereby resulting in Ca(2+) leak from ER pools followed by Ca(2+) influx via SOCs.
Conflict of interest statement
Figures
Similar articles
-
The sarco/endoplasmic reticulum Ca(2+) ATPase (SERCA) is the third element in capacitative calcium entry.Cell Calcium. 2010 May;47(5):412-8. doi: 10.1016/j.ceca.2010.03.001. Epub 2010 Mar 26. Cell Calcium. 2010. PMID: 20347143
-
STIM1 knockdown reveals that store-operated Ca2+ channels located close to sarco/endoplasmic Ca2+ ATPases (SERCA) pumps silently refill the endoplasmic reticulum.J Biol Chem. 2007 Apr 13;282(15):11456-64. doi: 10.1074/jbc.M609551200. Epub 2007 Feb 5. J Biol Chem. 2007. PMID: 17283081
-
Calcium entry-calcium refilling (CECR) coupling between store-operated Ca(2+) entry and sarco/endoplasmic reticulum Ca(2+)-ATPase.Cell Calcium. 2011 Mar;49(3):153-61. doi: 10.1016/j.ceca.2011.01.007. Epub 2011 Feb 24. Cell Calcium. 2011. PMID: 21353305
-
Sarco-Endoplasmic Reticulum Calcium Release Model Based on Changes in the Luminal Calcium Content.Adv Exp Med Biol. 2020;1131:337-370. doi: 10.1007/978-3-030-12457-1_14. Adv Exp Med Biol. 2020. PMID: 31646517 Review.
-
Privileged coupling between Ca(2+) entry through plasma membrane store-operated Ca(2+) channels and the endoplasmic reticulum Ca(2+) pump.Mol Cell Endocrinol. 2012 Apr 28;353(1-2):37-44. doi: 10.1016/j.mce.2011.08.021. Epub 2011 Aug 24. Mol Cell Endocrinol. 2012. PMID: 21878366 Review.
Cited by
-
Two pore channel 2 differentially modulates neural differentiation of mouse embryonic stem cells.PLoS One. 2013 Jun 12;8(6):e66077. doi: 10.1371/journal.pone.0066077. Print 2013. PLoS One. 2013. PMID: 23776607 Free PMC article.
-
A genetically targeted sensor reveals spatial and temporal dynamics of acrosomal calcium and sperm acrosome exocytosis.J Biol Chem. 2022 May;298(5):101868. doi: 10.1016/j.jbc.2022.101868. Epub 2022 Mar 27. J Biol Chem. 2022. PMID: 35346690 Free PMC article.
-
Two pore channel 2 (TPC2) inhibits autophagosomal-lysosomal fusion by alkalinizing lysosomal pH.J Biol Chem. 2013 Aug 16;288(33):24247-63. doi: 10.1074/jbc.M113.484253. Epub 2013 Jul 8. J Biol Chem. 2013. Retraction in: J Biol Chem. 2017 Jul 21;292(29):12088. doi: 10.1074/jbc.A113.484253. PMID: 23836916 Free PMC article. Retracted.
-
Calmodulin-Connexin Partnership in Gap Junction Channel Regulation-Calmodulin-Cork Gating Model.Int J Mol Sci. 2021 Dec 2;22(23):13055. doi: 10.3390/ijms222313055. Int J Mol Sci. 2021. PMID: 34884859 Free PMC article. Review.
-
Modulation of Connexin-36 Gap Junction Channels by Intracellular pH and Magnesium Ions.Front Physiol. 2018 Apr 12;9:362. doi: 10.3389/fphys.2018.00362. eCollection 2018. Front Physiol. 2018. PMID: 29706896 Free PMC article.
References
-
- Casey JR, Grinstein S, Orlowski J. Sensors and regulators of intracellular pH. Nature Reviews Molecular Cell Biology. 2010;11:50–61. - PubMed
-
- Srivastava J, Barber DL, Jacobson MP. Intracellular pH sensors: design principles and functional significance. Physiology. 2007;22:30–39. - PubMed
-
- Wakabayashi I, Poteser M, Groschner K. Intracellular pH as a determinant of vascular smooth muscle function. Journal of vascular research. 2006;43:238–250. - PubMed
-
- Lyall V, Biber TU. Potential-induced changes in intracellular pH. The American journal of physiology. 1994;266:F685–696. - PubMed
-
- Kirichok Y, Navarro B, Clapham DE. Whole-cell patch-clamp measurements of spermatozoa reveal an alkaline-activated Ca2+ channel. Nature. 2006;439:737–740. - PubMed
Publication types
MeSH terms
Substances
LinkOut - more resources
Full Text Sources
Miscellaneous
