. 2012;7(2):e31915.
doi: 10.1371/journal.pone.0031915. Epub 2012 Feb 23.

3T3 cell lines stably expressing Pax6 or Pax6(5a)--a new tool used for identification of common and isoform specific target genes

Affiliations

3T3 cell lines stably expressing Pax6 or Pax6(5a)--a new tool used for identification of common and isoform specific target genes

Yury Kiselev et al. PLoS One. 2012.

Abstract

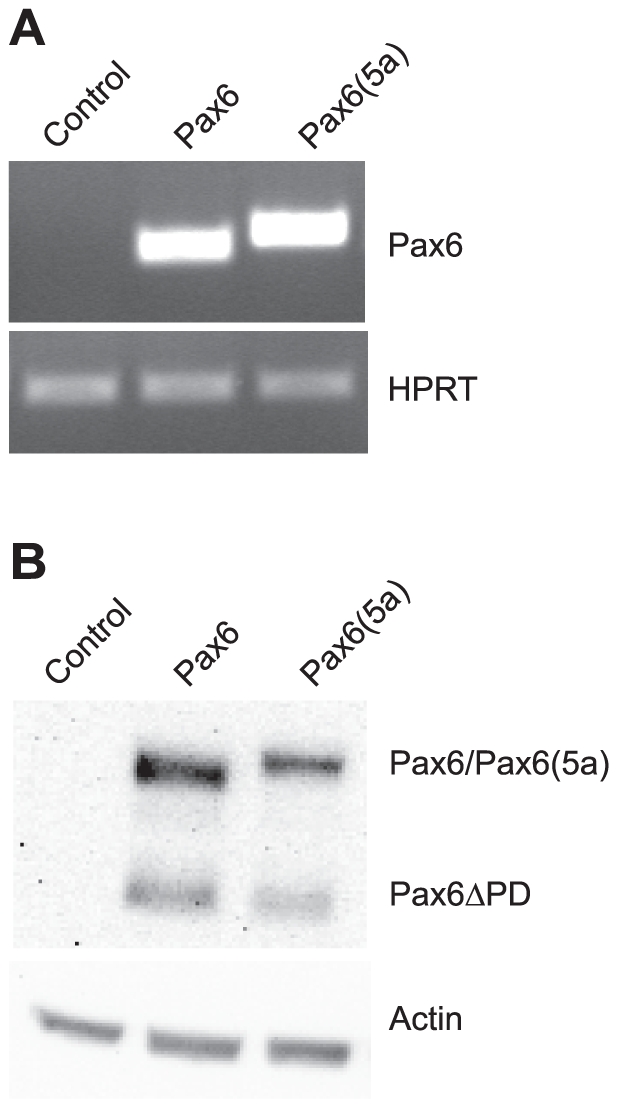
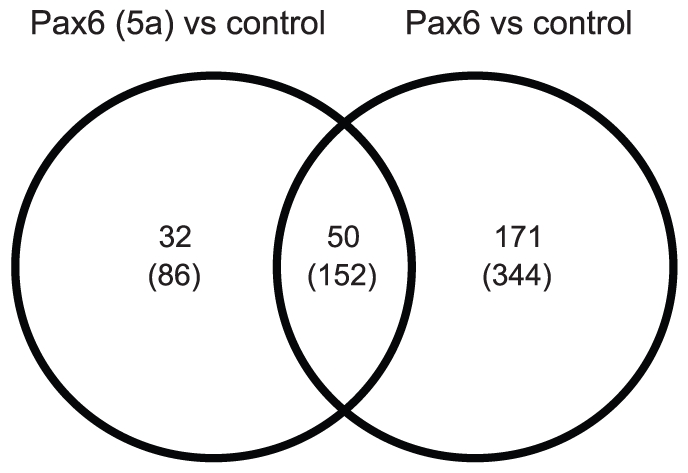
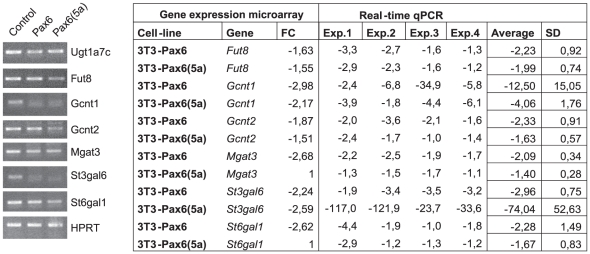
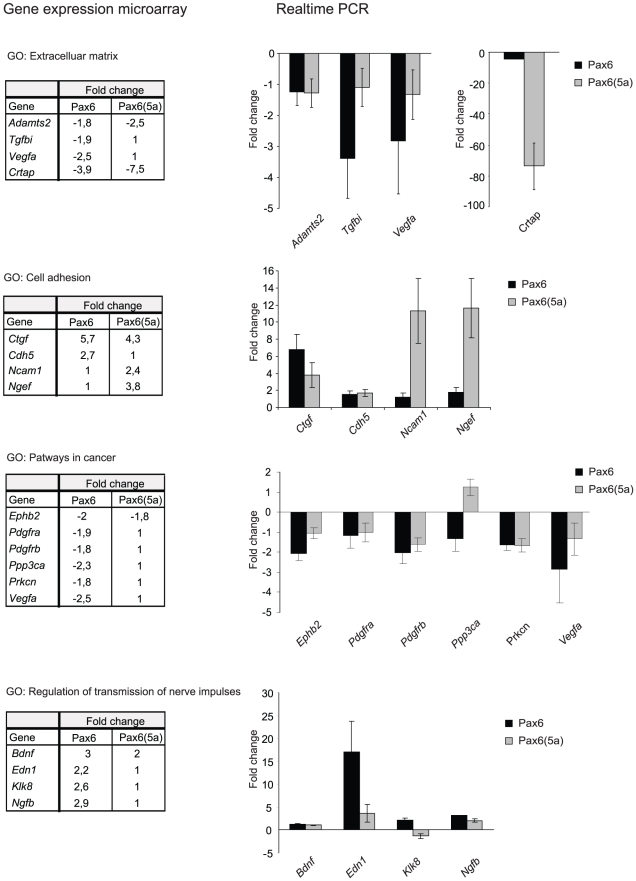
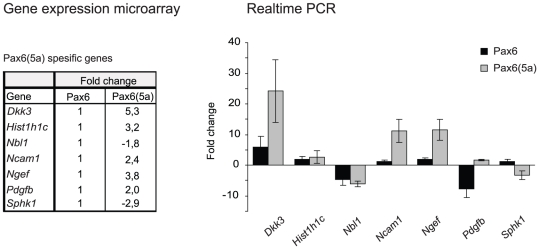
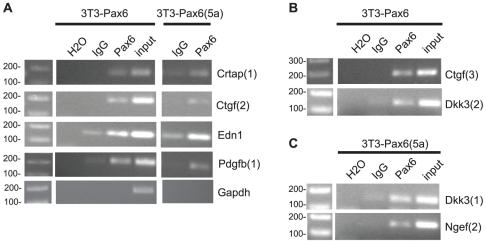
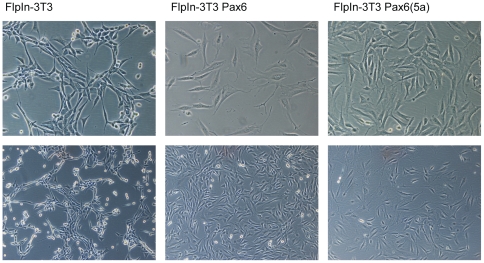
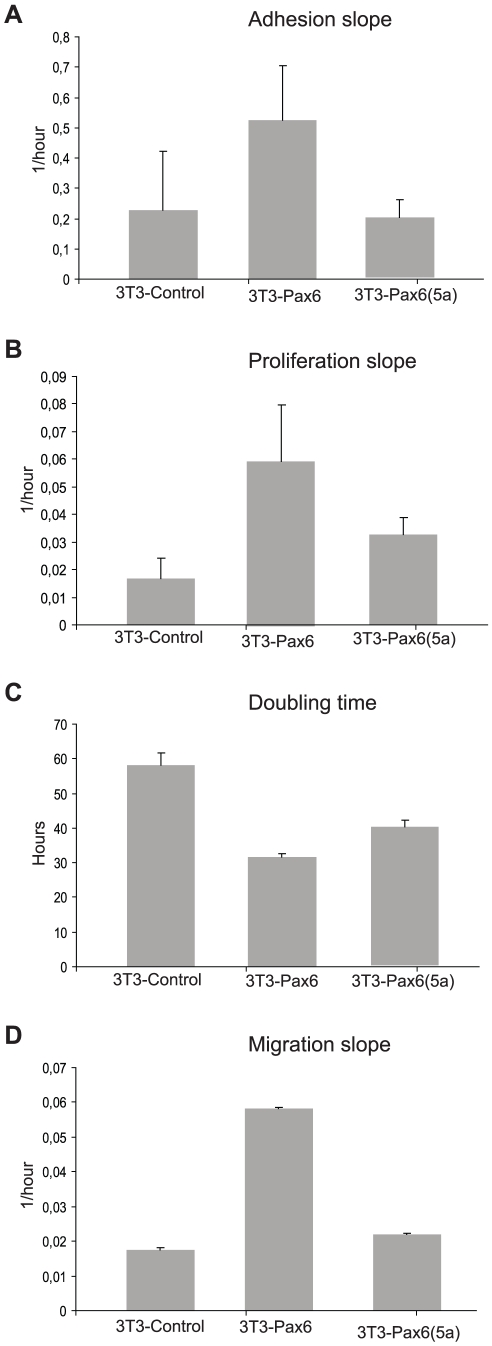
Pax6 and Pax6(5a) are two isoforms of the evolutionary conserved Pax6 gene often co-expressed in specific stochiometric relationship in the brain and the eye during development. The Pax6(5a) protein differs from Pax6 by having a 14 amino acid insert in the paired domain, causing the two proteins to have different DNA binding specificities. Difference in functions during development is proven by the fact that mutations in the 14 amino acid insertion for Pax6(5a) give a slightly different eye phenotype than the one described for Pax6. Whereas quite many Pax6 target genes have been published during the last years, few Pax6(5a) specific target genes have been reported on. However, target genes identified by Pax6 knockout studies can probably be Pax6(5a) targets as well, since this isoform also will be affected by the knockout. In order to identify new Pax6 target genes, and to try to distinguish between genes regulated by Pax6 and Pax6(5a), we generated FlpIn-3T3 cell lines stably expressing Pax6 or Pax6(5a). RNA was harvested from these cell lines and used in gene expression microarrays where we identified a number of genes differentially regulated by Pax6 and Pax6(5a). A majority of these were associated with the extracellular region. By qPCR we verified that Ncam1, Ngef, Sphk1, Dkk3 and Crtap are Pax6(5a) specific target genes, while Tgfbi, Vegfa, EphB2, Klk8 and Edn1 were confirmed as Pax6 specific target genes. Nbl1, Ngfb and seven genes encoding different glycosyl transferases appeared to be regulated by both. Direct binding to the promoters of Crtap, Ctgf, Edn1, Dkk3, Pdgfb and Ngef was verified by ChIP. Furthermore, a change in morphology of the stably transfected Pax6 and Pax6(5a) cells was observed, and the Pax6 expressing cells were shown to have increased proliferation and migration capacities.


Conflict of interest statement

Competing Interests: The authors have declared that no competing interests exist.

Figures

Figure 1
Figure 1. RT-PCR and Western blot confirm expression of the correct Pax6 isoform in the FlpIn-3T3 Pax6 and Pax6(5a) cell lines.
(A) RT-PCR primers were designed so that the alternatively spliced exon 5a (42 bp) would be included in the PCR product if present. HPRT specific primers were used to show equal input of cDNA. Neither Pax6 nor Pax6(5a) is present in the FlpIn-3T3 control cell line. (B) Western blot with a Pax6 specific antibody (Millipore # AB2237) confirms expression of Pax6 and Pax6(5a) proteins in the respective cell lines. The lower molecular weight band of equal size for each of the Pax6 cell lines is the Pax6ΔPD isoform generated from an internal AUG startcodon in the link between the paired domain and the homeodomain.
Figure 2
Figure 2. Venn diagram shows the number of individual and common sets of genes regulated by Pax6 and Pax6(5a) in a gene expression microarray.
Three RNA samples from the FlpIn-3T3 control cell line, three samples from the FlpIn-3T3 Pax6(5a) cell line and two samples from the FlpIn-3T3 Pax6 cell line were sent for microarray analysis on the Illumina Mouse Ref-8 V1.1 chip. The number of genes differentially regulated as scored by threshold 1 is shown, while use of threshold 2 gave numbers shown in parentheses. (Threshold 1 is FDR p-value 0.001, FC 1.7, log FC 0.77. Threshold 2 is FDR p-value 0.01, FC 1.5, log FC 0.58).
Figure 3
Figure 3. RT-PCR and real time qPCR with primers specific for seven glycosyl transferases confirms that this group of genes is downregulated by both Pax6 and Pax6(5a).
Primers were designed against Ugt1a7, Fut8, Gcnt2, St3gal6, St6gal1, Gcnt1 and Mgat3. All showed downregulation of transcription of these genes in both the Pax6 and the Pax6(5a) cell lines compared to the FlpIn-3T3 control cell line. Pictures are representative of three experiments. The fold change value (FC) from the gene expression microarray is included in the table to the right. The Fut8 FC values for Pax6 and Pax6(5a), and the Gcnt2 value for Pax6(5a) have a p-value = 0,01(threshold 2), while the rest of the FC values listed have a p-value of 0.001 (threshold1). Four independent real-time qPCR experiments are included (Exp.1-Exp.4), and the results are presented as FC in cDNA concentrations in the FlpIn-3T3 Pax6 and Pax6(5a) cell lines compared to the FlpIn-3T3 control cell line, after normalization against two housekeeping genes (Nono and Tfrc).
Figure 4
Figure 4. Real time quantitative PCR verifies differentially regulated genes in both the FlpIn-3T3 Pax6 and Pax6(5a) cell lines.
Primers were designed for genes representative for the gene ontology terms “Extracellular matrix” (Adamts2, Tgfbi, Vegfa and Crtap), “Cell adhesion” (Ctgf, Cdh5, Ncam1 and Ngef), “Pathways in cancer” (Ephb2, Pdgfra, Pdgfrb, Ppp3ca, Prkcn and Vegfa) and “Regulation of transmission of nerve impulses” (Bdnf, Edn1, Klk8 and Ngfb) and used in qPCR. Results are means of three independent experiments and are presented as fold change in cDNA concentrations in the FlpIn-3T3 Pax6 and Pax6(5a) cell lines compared to the FlpIn-3T3 control cell line, after normalization against two housekeeping genes. The fold change values obtained for the same genes in the Illumina gene expression microarray are given in the table to the left of each graph for comparison.
Figure 5
Figure 5. Real time quantitative PCR shows that Dkk3, Ncam1, Ngef and Sphk1 are strongly regulated by Pax6(5a).
Primers were designed for some of the genes showing differential expression only in the FlpIn-3T3 Pax6(5a) cell line (Dkk3, Hist1h1c, Nbl1, Ncam1, Ngef, Pdgfb, Sphk1). Real time quantitative PCR was performed as described in Fig. 4. The fold change values obtained for the same genes in the Illumina gene expression microarray are given in the table to the left of the graph for comparison.
Figure 6
Figure 6. Chromatin immunoprecipitation verifies binding of Pax6 and Pax6(5a) to the promoter region of several target genes.
Chromatin immunoprecipitation with an antibody against Pax6 was done for both the 3T3-Pax6 and the 3T3-Pax6(5a) cell line. IgG was used as a control. PCR primers were designed so that they should amplify target sequences with putative Pax6 and/or Pax6(5a) binding sites in the promoter regions of Crtap, Ctgf, Edn1, Pdgf, Dkk3 and Ngef. The number in parenthesis specifies the identity of the primerset used for the observed amplification. Genomic DNA sampled before adding the antibody (input) was used as a positive control for the PCR reaction, while water was used as a negative control. The promoter region of Gapdh was included as a region not expected to bind Pax6 or Pax6(5a).
Figure 7
Figure 7. The FlpIn-3T3 Pax6 and FlpIn-3T3 Pax6(5a) cell lines have changed morphology compared to the original FlpIn 3T3 cell line they were generated from.
This was repeatedly observed over several passages. Pax6 and Pax6(5a) expressing cells appeared more flattened and seemed to have more protrusions. The cells on the picture have passage numbers 17, 15 and 11 for the FlpIn-3T3, FlpIn-3T3 Pax6 and FlpIn-3T3 Pax6(5a) respectively. For the pictures on the upper row a 20× magnification is used, for the lower row a 10× magnification is used on a Zeizz Axiovert S100 Microscope with a Nikon Digital Sight DS-5 M camera.
Figure 8
Figure 8. Pax6 expressing FlpIn-3T3 cells have higher proliferation and higher migration capacity compared to FlpIn-3T3 control cells and Pax6(5a) expressing cells.
Control, Pax6 and Pax6(5a) cells were seeded in xCELLigence (Roche) proliferation plates, cells were left on the bench for 1 hr before the plates were put in the xCELLigence machine for measurements for 24 hrs. The measured values were used to calculate the (A) adhesion slope, (B) proliferation slope and (C) doubling time. For adhesion and proliferation slope analyses the mean and standard deviation of three independent experiments are shown. The doubling time analysis shows one representative experiment out of three, because absolute values were changing from experiment to experiment probably due to fluctuations in cell condition. However, described pattern of increased proliferation (Pax6>Pax6(5a)>control) was consistent in all experiments. Each experiment was done in triplicates (A–C). xCELLigence migration plates were used to measure the migration, and to calculate the migration slope (D). One representative experiment out of 3 is shown.

Similar articles

Cited by

References

    1. Walther C, Gruss P. Pax-6, a murine paired box gene, is expressed in the developing CNS. Development. 1991;113:1435–1449. - PubMed
    1. Yasuda T, Kajimoto Y, Fujitani Y, Watada H, Yamamoto S, et al. PAX6 mutation as a genetic factor common to aniridia and glucose intolerance. Diabetes. 2002;51:224–230. - PubMed
    1. Mitchell TN, Free SL, Williamson KA, Stevens JM, Churchill AJ, et al. Polymicrogyria and absence of pineal gland due to PAX6 mutation. Ann Neurol. 2003;53:658–663. - PubMed
    1. Davis LK, Meyer KJ, Rudd DS, Librant AL, Epping EA, et al. Pax6 3′ deletion results in aniridia, autism and mental retardation. Hum Genet. 2008;123:371–378. - PMC - PubMed
    1. Estivill-Torrus G, Vitalis T, Fernandez-Llebrez P, Price DJ. The transcription factor Pax6 is required for development of the diencephalic dorsal midline secretory radial glia that form the subcommissural organ. Mech Dev. 2001;109:215–224. - PubMed

Publication types

MeSH terms