

Low-replicating viruses and strong anti-viral immune response associated with prolonged disease control in a superinfected HIV-1 LTNP elite controller
- PMID: 22384103
- PMCID: PMC3286446
- DOI: 10.1371/journal.pone.0031928
Low-replicating viruses and strong anti-viral immune response associated with prolonged disease control in a superinfected HIV-1 LTNP elite controller
Abstract
Objective: To study the causes for the lack of clinical progression in a superinfected HIV-1 LTNP elite controller patient.
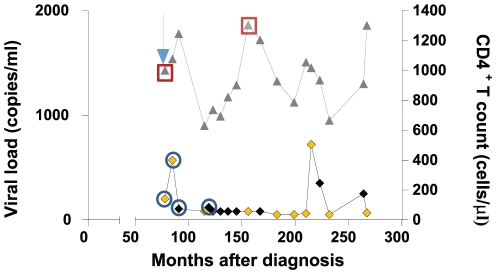
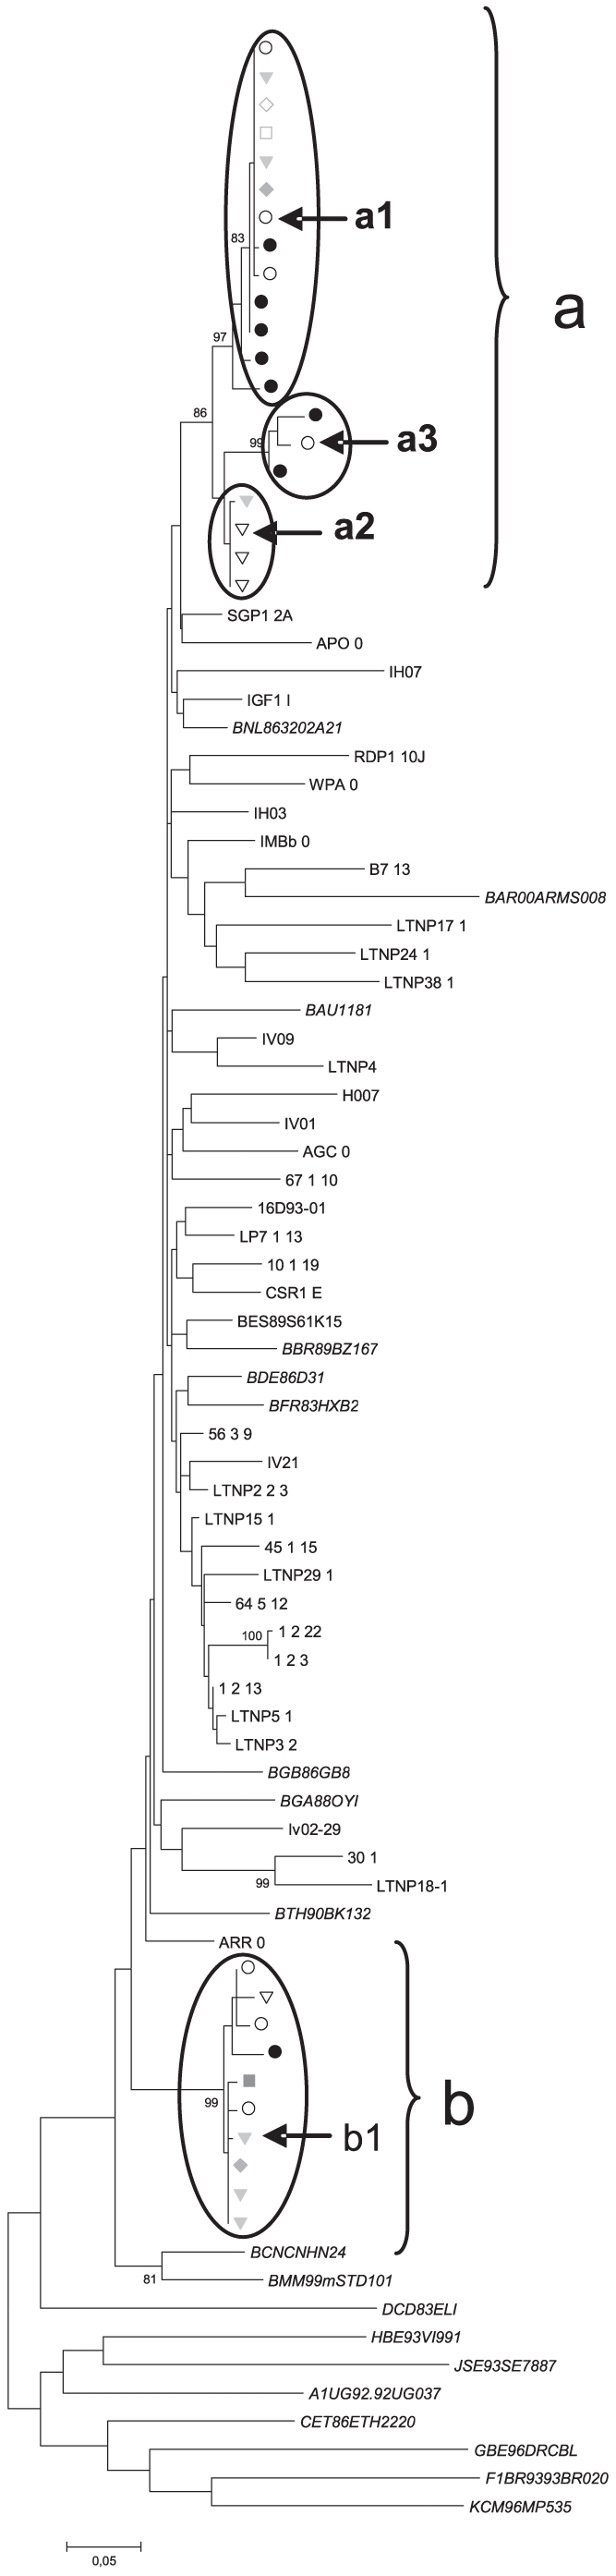
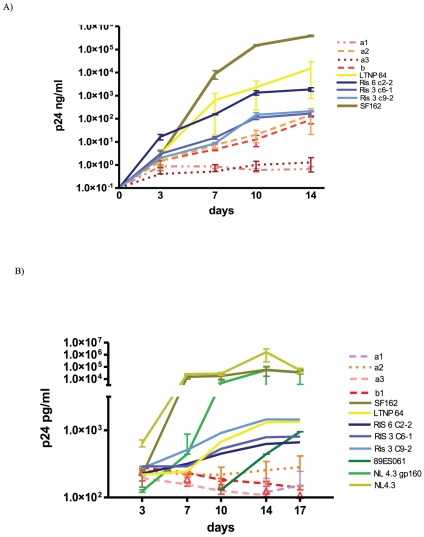
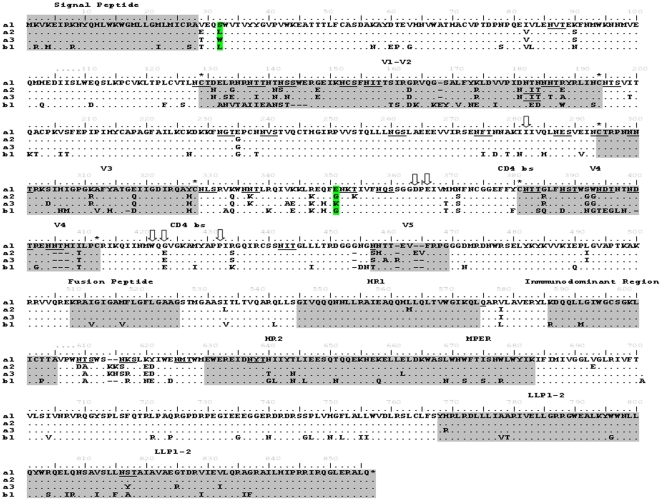
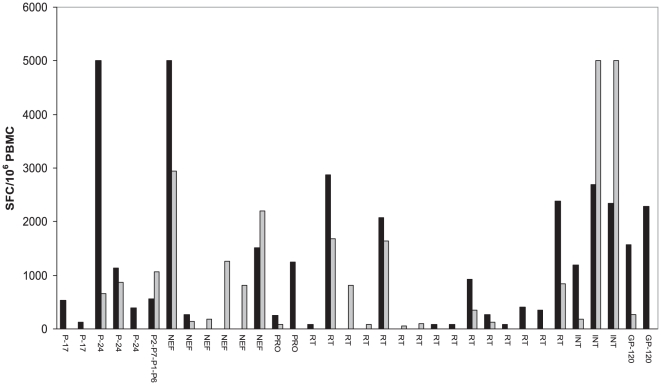
Methodology and principal findings: We studied host genetic, virological and immunological factors associated with viral control in a SI long term non progressor elite controller (LTNP-EC). The individual contained both viruses and maintained undetectable viral loads for >20 years and he did not express any of the described host genetic polymorphisms associated with viral control. None of four full-length gp160 recombinants derived from the LTNP-EC replicated in heterologous peripheral blood mononuclear cells. CTL responses after SI were maintained in two samples separated by 9 years and they were higher in breadth and magnitude than responses seen in most of 250 treatment naïve patients and also 25 controller subjects. The LTNP-EC showed a neutralization response, against 4 of the 6 viruses analyzed, superior to other ECs.
Conclusions: The study demonstrated that a strong and sustained cellular and humoral immune response and low replicating viruses are associated with viral control in the superinfected LTNP-EC.
Conflict of interest statement
Figures
Similar articles
-
Viral Characteristics Associated with the Clinical Nonprogressor Phenotype Are Inherited by Viruses from a Cluster of HIV-1 Elite Controllers.mBio. 2018 Apr 10;9(2):e02338-17. doi: 10.1128/mBio.02338-17. mBio. 2018. PMID: 29636433 Free PMC article.
-
Mechanisms of HIV non-progression; robust and sustained CD4+ T-cell proliferative responses to p24 antigen correlate with control of viraemia and lack of disease progression after long-term transfusion-acquired HIV-1 infection.Retrovirology. 2008 Dec 11;5:112. doi: 10.1186/1742-4690-5-112. Retrovirology. 2008. PMID: 19077215 Free PMC article.
-
Prevalence of HIV-1 dual infection in long-term nonprogressor-elite controllers.J Acquir Immune Defic Syndr. 2013 Nov 1;64(3):225-31. doi: 10.1097/QAI.0b013e31829bdc85. J Acquir Immune Defic Syndr. 2013. PMID: 23714744
-
Elite controllers and lessons learned for HIV-1 cure.Curr Opin Virol. 2019 Oct;38:31-36. doi: 10.1016/j.coviro.2019.05.010. Epub 2019 Jun 27. Curr Opin Virol. 2019. PMID: 31252326 Review.
-
Omic Technologies in HIV: Searching Transcriptional Signatures Involved in Long-Term Non-Progressor and HIV Controller Phenotypes.Front Immunol. 2022 Jul 1;13:926499. doi: 10.3389/fimmu.2022.926499. eCollection 2022. Front Immunol. 2022. PMID: 35844607 Free PMC article. Review.
Cited by
-
The inference of HIV-1 transmission direction between HIV-1 positive couples based on the sequences of HIV-1 quasi-species.BMC Infect Dis. 2019 Jun 28;19(1):566. doi: 10.1186/s12879-019-4163-4. BMC Infect Dis. 2019. PMID: 31253127 Free PMC article.
-
The Characteristics of the HIV-1 Env Glycoprotein Are Linked With Viral Pathogenesis.Front Microbiol. 2022 Mar 24;13:763039. doi: 10.3389/fmicb.2022.763039. eCollection 2022. Front Microbiol. 2022. PMID: 35401460 Free PMC article.
-
Deep sequencing of the HIV-1 polymerase gene for characterisation of cytotoxic T-lymphocyte epitopes during early and chronic disease stages.Virol J. 2022 Mar 28;19(1):56. doi: 10.1186/s12985-022-01772-8. Virol J. 2022. PMID: 35346259 Free PMC article.
-
Elite controllers: A heterogeneous group of HIV-infected patients.Virulence. 2020 Dec;11(1):889-897. doi: 10.1080/21505594.2020.1788887. Virulence. 2020. PMID: 32698654 Free PMC article. Review.
-
Natural Killer Cells in Antibody Independent and Antibody Dependent HIV Control.Front Immunol. 2022 May 20;13:879124. doi: 10.3389/fimmu.2022.879124. eCollection 2022. Front Immunol. 2022. PMID: 35720328 Free PMC article. Review.
References
-
- Deacon NJ, Tsykin A, Solomon A, Smith K, Ludford-Menting M, et al. Genomic Structure of an Attenuated Quasi Species of HIV-1 from a Blood Transfusion Donor and Recipients. Science. 1995;270:988–991. - PubMed
Publication types
MeSH terms
Substances
Grants and funding
LinkOut - more resources
Full Text Sources
