. 2012;7(2):e31939.
doi: 10.1371/journal.pone.0031939. Epub 2012 Feb 27.

Interleukin-7 links T lymphocyte and intestinal epithelial cell homeostasis

Affiliations

Interleukin-7 links T lymphocyte and intestinal epithelial cell homeostasis

Shabnam Shalapour et al. PLoS One. 2012.

Abstract

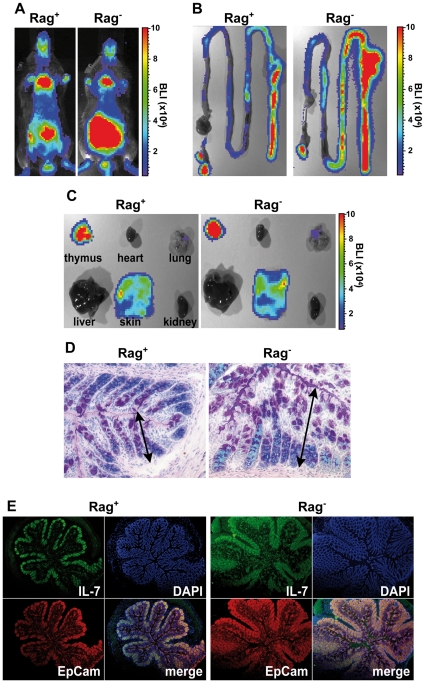
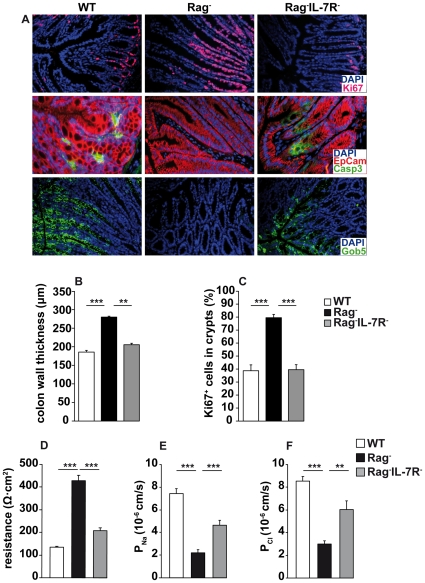
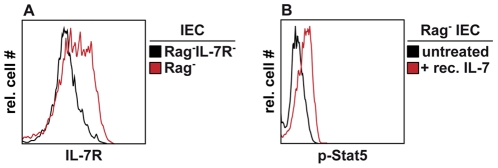
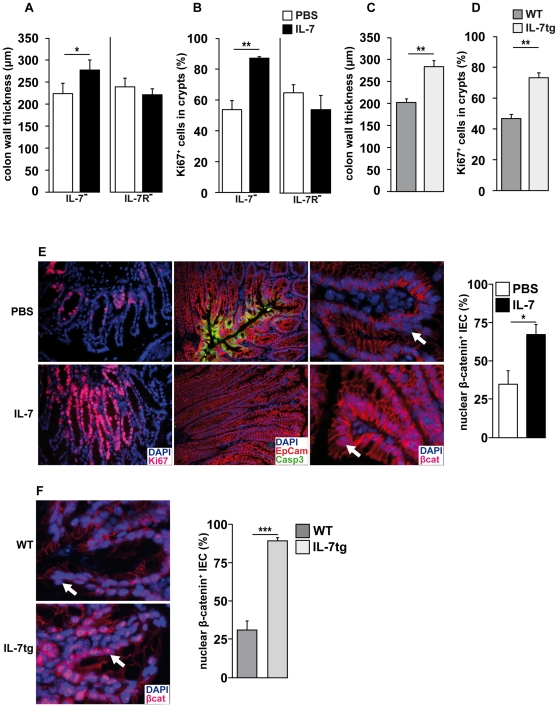
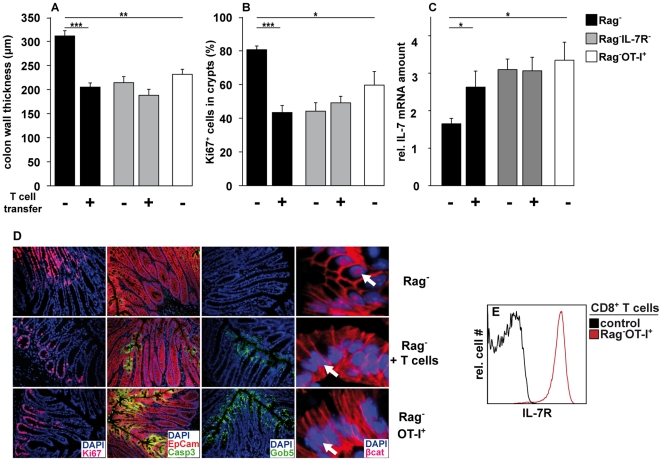
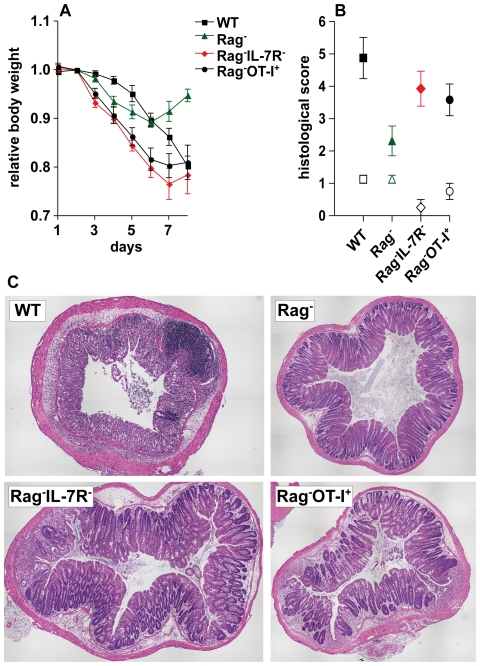
Interleukin-7 (IL-7) is a major survival factor for mature T cells. Therefore, the degree of IL-7 availability determines the size of the peripheral T cell pool and regulates T cell homeostasis. Here we provide evidence that IL-7 also regulates the homeostasis of intestinal epithelial cells (IEC), colon function and the composition of the commensal microflora. In the colon of T cell-deficient, lymphopenic mice, IL-7-producing IEC accumulate. IEC hyperplasia can be blocked by IL-7-consuming T cells or the inactivation of the IL-7/IL-7R signaling pathway. However, the blockade of the IL-7/IL-7R signaling pathway renders T cell-deficient mice more sensitive to chemically-induced IEC damage and subsequent colitis. In summary, our data demonstrate that IL-7 promotes IEC hyperplasia under lymphopenic conditions. Under non-lymphopenic conditions, however, T cells consume IL-7 thereby limiting IEC expansion and survival. Hence, the degree of IL-7 availability regulates both, T cell and IEC homeostasis.


Conflict of interest statement

Competing Interests: The authors have declared that no competing interests exist.

Figures

Figure 1
Figure 1. Elevated levels of IL-7 expression and IEC hyperplasia in the colon of Rag mice.
(A) Representative bioluminescence (BL) images for Rag-competent (Rag+; n = 31) and Rag-deficient IL-7GCDL mice (Rag; n = 21) are shown. BL was determined (B) in the intestine and (C) thymus, heart, lung, liver, skin and kidney of Rag+ (n = 12) and Rag IL-7GCDL mice (n = 12). (A–C) BL is shown in photons per s per cm2 per steradian. (D, E) Colon sections from Rag+ (n = 5–8) and Rag IL-7GCDL mice (n = 6–8) were stained with (D) periodic acid-Schiff (PAS)/Alcian blue (AB) or (E) DAPI and antibodies for IL-7 and EpCam. (D) Differentiated goblet cells stain positive for PAS (red) and appear purple/magenta. Acidic mucopolysaccharides/glycosaminoglycans are visualized by AB. Arrows indicate the distance between the basis of the crypts and the colon lumen. (D, E) Data are representative for 3 independent experiments and 2–3 staining reactions per mouse.
Figure 2
Figure 2. IL-7R signaling promotes lymphopenia-associated IEC hyperplasia and alters colon function.
(A) Colon sections from WT (n = 13–16), Rag (n = 16–37) and RagIL-7R mice (n = 13) were stained with DAPI and antibodies for Ki67, EpCam, cleaved caspase 3 (Casp3) or Gob5. (B) Colon wall thickness (µm) and (C) the percentage of Ki67+ cells in crypts were determined for WT (n = 6), Rag (n = 12) and RagIL-7R (n = 6) mice. (B, C) 30–60 individual measurements were performed. (A–C) Data are representative for 4 independent experiments and 2–3 staining reactions per mouse. (D) Transepithelial resistance (Ω·cm2), and apparent permeabilities (P) for (E) Na+ and (F) Cl were determined for colon samples from WT (n = 6), Rag (n = 5) and RagIL-7R (n = 5) mice. Five to twelve independent measurements per experimental group were performed. (B–F) Shown are mean values+SEM. Statistically significant values are indicated: ** p<0.01 and *** p<0.001 (Student's t test).
Figure 3
Figure 3. IEC express functional IL-7R.
(A, B) IEC were isolated from the colon of (A) RagIL-7R and (A, B) Rag mice. (B) Rag IEC were stimulated with 20 ng/ml rec. IL-7 for 15 minutes or were left untreated. The levels of IL-7R expression and Stat5 phosphorylation (p-Stat5) were determined by flow cytometry. (A, B) Shown are relative cell numbers and relative fluorescence intensities for (A) IL-7R and (B) p-Stat5 after gating on viable (A) (7AAD), (A, B) CD45, EpCam+ IEC. Results are representative for 2–3 independent experiments.
Figure 4
Figure 4. IL-7 promotes IEC proliferation and survival.
(A, B) RagIL-7 (IL-7; n = 3) and RagIL-7R (IL-7R; n = 3) mice were treated with PBS (white bars) or IL-7/anti-IL-7 (black bars) twice a week for 2 weeks. (A, C) Colon wall thickness (µm) and (B, D) the percentage of Ki67+ cells in crypts were determined in colon sections from (A, B) IL-7-treated RagIL-7 and RagIL-7R mice and (C, D) untreated WT (n = 6) and IL-7tg (n = 5) mice. (A) 30–54, (B) 15–23, (C) 47–68 and (D) 29–32 individual measurements were performed per experimental group. Shown are mean values+SEM. Statistically significant values are indicated: * p<0.05 and ** p<0.01 (Student's t test). (E) Colon sections from PBS-treated (upper row) and IL-7/anti-IL-7-treated RagIL-7 (lower row; n = 3) were stained with DAPI and antibodies for Ki67, EpCam, cleaved caspase 3 (Casp3) or β-catenin (βcat). (F) Colon sections from WT (n = 5) and IL-7tg mice (n = 6) were stained with DAPI and antibodies for β-catenin. (E, F) White arrows indicate nuclei. Bar diagrams show the percentage of luminal IEC with nuclear β-catenin. 130–280 nuclei per experimental group were counted. Shown are mean values+SEM. Statistically significant values are indicated: * p<0.05 and ** p<0.01 (Student's t test). (A–F) Data represent one experiment with a total of 23 individual mice and 2–3 independent staining reactions per mouse.
Figure 5
Figure 5. T lymphocytes regulate IEC homeostasis in an antigen-independent, IL-7R-dependent fashion.
(A, B) Rag (n = 6) and RagIL-7R (n = 7) were reconstituted with 5×10⁶ polyclonal CD4+ and CD8+ T cells from Thy1.1-congenic mice. Untreated Rag (n = 8) and RagIL-7R (n = 7) served as controls. Eighty-five days after transfer, colon sections were prepared and analyzed for (A) colon wall thickness (µm) and (B) the percentage of Ki67+ cells in crypts. Data are representative for 2 independent experiments. (A, B) Colon sections from untreated RagOT-I+ mice (n = 5) were analyzed in parallel. (A) 45–62 and (B) 26–43 individual measurements were performed per experimental group. (C) Relative IL-7 mRNA levels were determined in relation to β-actin mRNA levels in the colon of the indicated groups (Rag n = 12; Rag+T cells n = 8; Rag IL-7R n = 8; Rag IL-7R+T cells n = 8; Rag OTI+ n = 5). (A–C) Shown are mean values+SEM. Statistically significant values are indicated: * p<0.05, ** p<0.01, *** p<0.001 (Student's t test). (D) Colon sections from untreated Rag (n = 37), T cell-reconstituted Rag (n = 6) and RagOT-I+ mice (n = 5) were stained with DAPI and antibodies for Ki67, EpCam, cleaved caspase 3 (Casp3), Gob5 or β-catenin (βcat). White arrows indicate nuclei. Data are representative for at least two independent experiments and 2–3 staining reactions per mouse. (E) RagOT-I+ spleen cells were analyzed by flow cytometry. Shown are relative cell numbers and fluorescence intensities for IL-7R on CD8+ OT-I T cells (RagOT-I+). In control samples, primary antibodies were omitted. Results are representative for 2 independent experiments.
Figure 6
Figure 6. IL-7R signaling protects Rag mice from DSS-induced colitis.
(A, B) WT (n = 4), Rag (n = 8), RagIL-7R (n = 7) and RagOT-I+ mice (n = 6) received dextran sulfate sodium (DSS) via the drinking water. From day 5 on, DSS-free drinking water was provided. (A) Body weight was determined every day and calculated in relation to the initial body weight. Shown are the mean relative body weight ± SEM and the time after onset of DSS treatment. (B, C) Colon samples were taken at day 8 and analyzed histologically. Shown are histological scores for groups of untreated (open symbols; n = 4) and DSS-treated mice (closed symbols; n = 6–8). (C) Shown are representative colon sections from the indicated mice. (A–C) Data represent one experiment.

Similar articles

Cited by

References

    1. Jameson SC. Maintaining the norm: T-cell homeostasis. Nat Rev Immunol. 2002;2:547–556. - PubMed
    1. Khaled AR, Durum SK. Lymphocide: cytokines and the control of lymphoid homeostasis. Nat Rev Immunol. 2002;2:817–830. - PubMed
    1. Park JH, Yu Q, Erman B, Appelbaum JS, Montoya-Durango D, et al. Suppression of IL7Ralpha transcription by IL-7 and other prosurvival cytokines: a novel mechanism for maximizing IL-7-dependent T cell survival. Immunity. 2004;21:289–302. - PubMed
    1. Napolitano LA, Grant RM, Deeks SG, Schmidt D, De Rosa SC, et al. Increased production of IL-7 accompanies HIV-1-mediated T-cell depletion: implications for T-cell homeostasis. Nat Med. 2001;7:73–79. - PubMed
    1. Guimond M, Veenstra RG, Grindler DJ, Zhang H, Cui Y, et al. Interleukin 7 signaling in dendritic cells regulates the homeostatic proliferation and niche size of CD4+ T cells. Nat Immunol. 2009;10:149–157. - PMC - PubMed

Publication types

LinkOut - more resources