Characterization of synaptically connected nuclei in a potential sensorimotor feedback pathway in the zebra finch song system
- PMID: 22384172
- PMCID: PMC3285214
- DOI: 10.1371/journal.pone.0032178
Characterization of synaptically connected nuclei in a potential sensorimotor feedback pathway in the zebra finch song system
Abstract
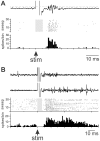
Birdsong is a learned behavior that is controlled by a group of identified nuclei, known collectively as the song system. The cortical nucleus HVC (used as a proper name) is a focal point of many investigations as it is necessary for song production, song learning, and receives selective auditory information. HVC receives input from several sources including the cortical area MMAN (medial magnocellular nucleus of the nidopallium). The MMAN to HVC connection is particularly interesting as it provides potential sensorimotor feedback to HVC. To begin to understand the role of this connection, we investigated the physiological relation between MMAN and HVC activity with simultaneous multiunit extracellular recordings from these two nuclei in urethane anesthetized zebra finches. As previously reported, we found similar timing in spontaneous bursts of activity in MMAN and HVC. Like HVC, MMAN responds to auditory playback of the bird's own song (BOS), but had little response to reversed BOS or conspecific song. Stimulation of MMAN resulted in evoked activity in HVC, indicating functional excitation from MMAN to HVC. However, inactivation of MMAN resulted in no consistent change in auditory responses in HVC. Taken together, these results indicate that MMAN provides functional excitatory input to HVC but does not provide significant auditory input to HVC in anesthetized animals. We hypothesize that MMAN may play a role in motor reinforcement or coordination, or may provide modulatory input to the song system about the internal state of the animal as it receives input from the hypothalamus.
Conflict of interest statement
Figures


Similar articles
-
Functional evidence for internal feedback in the songbird brain nucleus HVC.Neuroreport. 2008 Apr 16;19(6):679-82. doi: 10.1097/WNR.0b013e3282fb7dae. Neuroreport. 2008. PMID: 18382286
-
Synaptic interactions underlying song-selectivity in the avian nucleus HVC revealed by dual intracellular recordings.J Neurophysiol. 2006 Feb;95(2):1158-75. doi: 10.1152/jn.00100.2005. J Neurophysiol. 2006. PMID: 16424457
-
Axonal connections of the medial magnocellular nucleus of the anterior neostriatum in zebra finches.J Comp Neurol. 1997 Jun 9;382(3):364-81. doi: 10.1002/cne.903820305. J Comp Neurol. 1997. PMID: 9183699
-
At the interface of the auditory and vocal motor systems: NIf and its role in vocal processing, production and learning.J Physiol Paris. 2013 Jun;107(3):178-92. doi: 10.1016/j.jphysparis.2013.04.001. Epub 2013 Apr 17. J Physiol Paris. 2013. PMID: 23603062 Free PMC article. Review.
-
A species-specific view of song representation in a sensorimotor nucleus.J Physiol Paris. 2013 Jun;107(3):193-202. doi: 10.1016/j.jphysparis.2012.08.004. Epub 2012 Aug 30. J Physiol Paris. 2013. PMID: 22960663 Review.
Cited by
-
A subcortical circuit linking the cerebellum to the basal ganglia engaged in vocal learning.Elife. 2018 Jul 25;7:e32167. doi: 10.7554/eLife.32167. Elife. 2018. PMID: 30044222 Free PMC article.
-
The respiratory-vocal system of songbirds: anatomy, physiology, and neural control.Prog Brain Res. 2014;212:297-335. doi: 10.1016/B978-0-444-63488-7.00015-X. Prog Brain Res. 2014. PMID: 25194204 Free PMC article. Review.
-
Lesions in a songbird vocal circuit increase variability in song syntax.Elife. 2024 Apr 18;13:RP93272. doi: 10.7554/eLife.93272. Elife. 2024. PMID: 38635312 Free PMC article.
-
The basal ganglia is necessary for learning spectral, but not temporal, features of birdsong.Neuron. 2013 Oct 16;80(2):494-506. doi: 10.1016/j.neuron.2013.07.049. Epub 2013 Sep 26. Neuron. 2013. PMID: 24075977 Free PMC article.
-
The expression of delta opioid receptor mRNA in adult male zebra finches (Taenopygia guttata).PLoS One. 2021 Aug 31;16(8):e0256599. doi: 10.1371/journal.pone.0256599. eCollection 2021. PLoS One. 2021. PMID: 34464410 Free PMC article.
References
-
- Nottebohm F, Stokes TM, Leonard CM. Central control of song in the canary, Serinus canarius. J Comp Neurol. 1976;165:457–486. - PubMed
-
- Fortune ES, Margoliash D. Parallel pathways and convergence onto HVc and adjacent neostriatum of adult zebra finches (Taeniopygia guttata). J Comp Neurol. 1995;360:413–441. - PubMed
-
- Yu AC, Margoliash D. Temporal hierarchical control of singing in birds. Science. 1996;273:1871–1875. - PubMed
Publication types
MeSH terms
LinkOut - more resources
Full Text Sources
Research Materials

