

Phenotypic plasticity influences the size, shape and dynamics of the geographic distribution of an invasive plant
- PMID: 22384216
- PMCID: PMC3288080
- DOI: 10.1371/journal.pone.0032323
Phenotypic plasticity influences the size, shape and dynamics of the geographic distribution of an invasive plant
Abstract
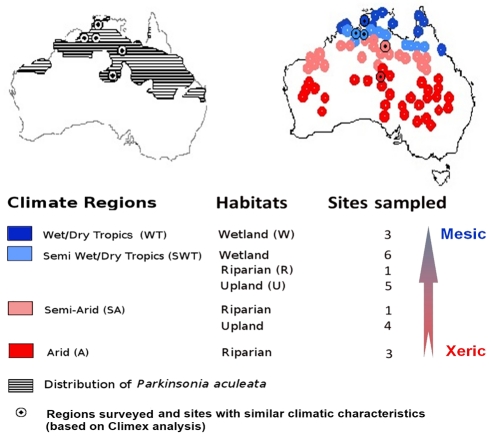
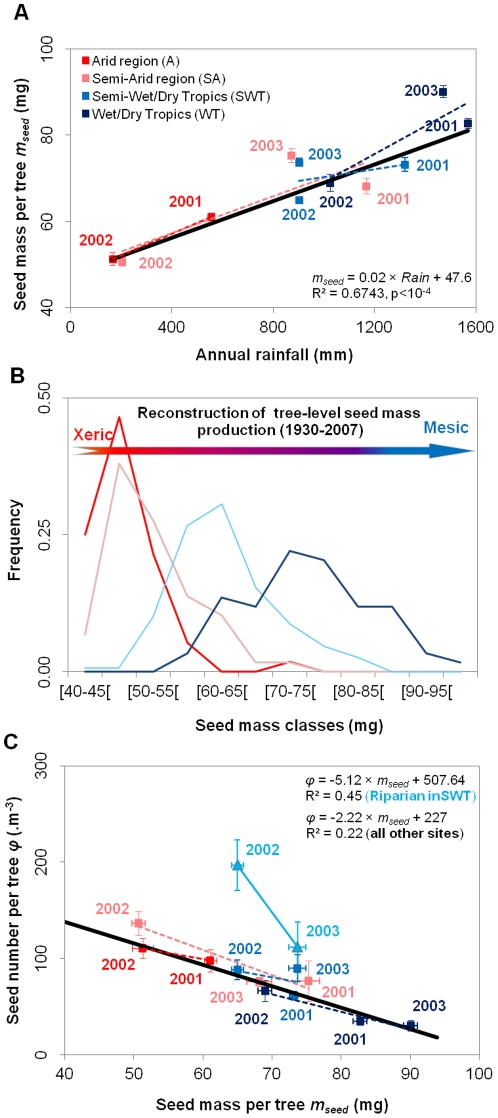
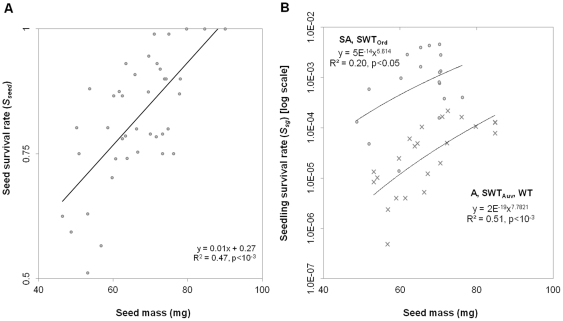
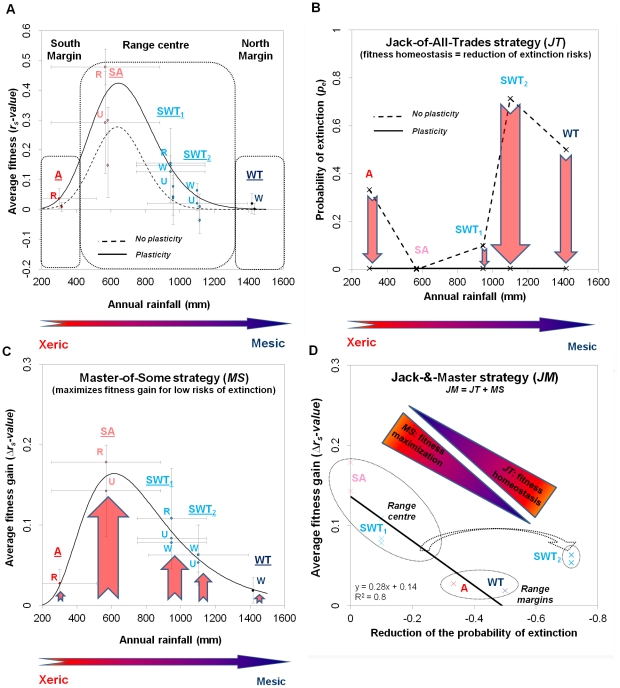
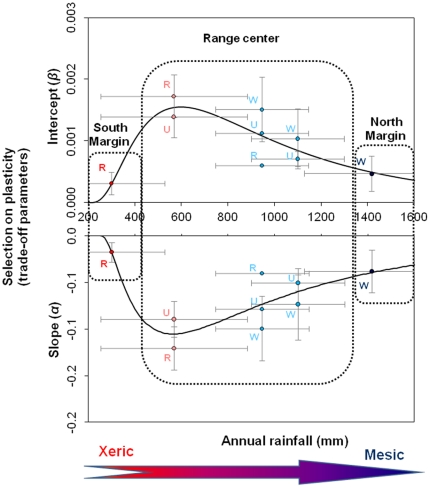
Phenotypic plasticity has long been suspected to allow invasive species to expand their geographic range across large-scale environmental gradients. We tested this possibility in Australia using a continental scale survey of the invasive tree Parkinsonia aculeata (Fabaceae) in twenty-three sites distributed across four climate regions and three habitat types. Using tree-level responses, we detected a trade-off between seed mass and seed number across the moisture gradient. Individual trees plastically and reversibly produced many small seeds at dry sites or years, and few big seeds at wet sites and years. Bigger seeds were positively correlated with higher seed and seedling survival rates. The trade-off, the relation between seed mass, seed and seedling survival, and other fitness components of the plant life-cycle were integrated within a matrix population model. The model confirms that the plastic response resulted in average fitness benefits across the life-cycle. Plasticity resulted in average fitness being positively maintained at the wet and dry range margins where extinction risks would otherwise have been high ("Jack-of-all-Trades" strategy JT), and fitness being maximized at the species range centre where extinction risks were already low ("Master-of-Some" strategy MS). The resulting hybrid "Jack-and-Master" strategy (JM) broadened the geographic range and amplified average fitness in the range centre. Our study provides the first empirical evidence for a JM species. It also confirms mechanistically the importance of phenotypic plasticity in determining the size, the shape and the dynamic of a species distribution. The JM allows rapid and reversible phenotypic responses to new or changing moisture conditions at different scales, providing the species with definite advantages over genetic adaptation when invading diverse and variable environments. Furthermore, natural selection pressure acting on phenotypic plasticity is predicted to result in maintenance of the JT and strengthening of the MS, further enhancing the species invasiveness in its range centre.
Conflict of interest statement
Figures
Similar articles
-
Patterns of cross-continental variation in tree seed mass in the Canadian Boreal Forest.PLoS One. 2013 Apr 11;8(4):e61060. doi: 10.1371/journal.pone.0061060. Print 2013. PLoS One. 2013. PMID: 23593392 Free PMC article.
-
Seed local adaptation and seedling plasticity account for Gleditsia triacanthos tree invasion across biomes.Ann Bot. 2019 Sep 24;124(2):307-318. doi: 10.1093/aob/mcz077. Ann Bot. 2019. PMID: 31218361 Free PMC article.
-
Clinal variations in seedling traits and responses to water availability correspond to seed-source environmental gradients in a foundational dryland tree species.Ann Bot. 2023 Oct 18;132(2):203-216. doi: 10.1093/aob/mcad041. Ann Bot. 2023. PMID: 36905361 Free PMC article.
-
Seeds of future past: climate change and the thermal memory of plant reproductive traits.Biol Rev Camb Philos Soc. 2019 Apr;94(2):439-456. doi: 10.1111/brv.12461. Epub 2018 Sep 6. Biol Rev Camb Philos Soc. 2019. PMID: 30188004 Review.
-
Climate change and biological invasions: evidence, expectations, and response options.Biol Rev Camb Philos Soc. 2017 Aug;92(3):1297-1313. doi: 10.1111/brv.12282. Epub 2016 May 31. Biol Rev Camb Philos Soc. 2017. PMID: 27241717 Review.
Cited by
-
Know your enemy: Application of ATR-FTIR spectroscopy to invasive species control.PLoS One. 2022 Jan 7;17(1):e0261742. doi: 10.1371/journal.pone.0261742. eCollection 2022. PLoS One. 2022. PMID: 34995300 Free PMC article.
-
Investigating the Phenotypic Plasticity of the Invasive Weed Trianthema portulacastrum L.Plants (Basel). 2021 Dec 27;11(1):77. doi: 10.3390/plants11010077. Plants (Basel). 2021. PMID: 35009081 Free PMC article.
-
Patterns of cross-continental variation in tree seed mass in the Canadian Boreal Forest.PLoS One. 2013 Apr 11;8(4):e61060. doi: 10.1371/journal.pone.0061060. Print 2013. PLoS One. 2013. PMID: 23593392 Free PMC article.
-
The interacting effects of ungulate hoofprints and predatory native ants on metamorph cane toads in tropical Australia.PLoS One. 2013 Nov 8;8(11):e79496. doi: 10.1371/journal.pone.0079496. eCollection 2013. PLoS One. 2013. PMID: 24255703 Free PMC article.
-
Rapid changes in seed dispersal traits may modify plant responses to global change.AoB Plants. 2019 Mar 28;11(3):plz020. doi: 10.1093/aobpla/plz020. eCollection 2019 Jun. AoB Plants. 2019. PMID: 31198528 Free PMC article. Review.
References
-
- Darwin C. Charles Darwin's natural selection; In: Stauffer RC, editor. Cambridge: Cambridge University Press; 1856–58 [pub. 1975].
-
- Dansereau P. Biogeography: an ecological perspective. New York. 1957:86–101.
-
- Busby J. BIOCLIM-a bioclimate analysis and prediction system. Plant Protection Quarterly. 1991;6:8–9.
-
- Davis MB, Shaw RG. Range shifts and adaptive responses to Quaternary climate change. Science. 2001;292:673–679. - PubMed
-
- Thomas CD, Bodsworth EJ, Wilson RJ, Simmons AD, Davies ZG, et al. Ecological and evolutionary processes at expanding range margins. Nature. 2001;411:577–581. - PubMed
Publication types
MeSH terms
LinkOut - more resources
Full Text Sources
