. 2012;7(2):e32499.
doi: 10.1371/journal.pone.0032499. Epub 2012 Feb 24.

Differential splicing alters subcellular localization of the alpha but not beta isoform of the MIER1 transcriptional regulator in breast cancer cells

Affiliations

Differential splicing alters subcellular localization of the alpha but not beta isoform of the MIER1 transcriptional regulator in breast cancer cells

Jaclyn A Clements et al. PLoS One. 2012.

Abstract

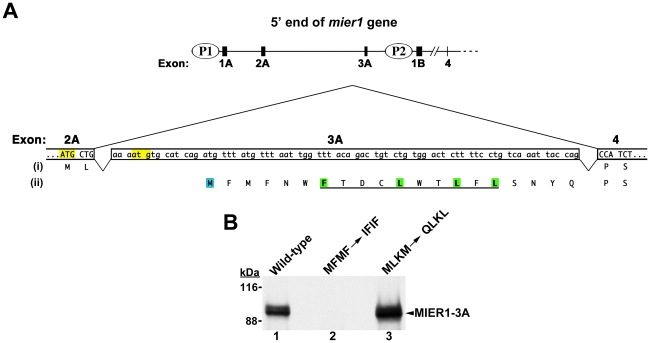
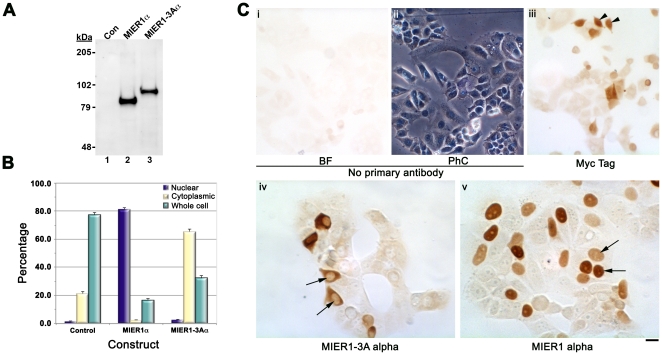
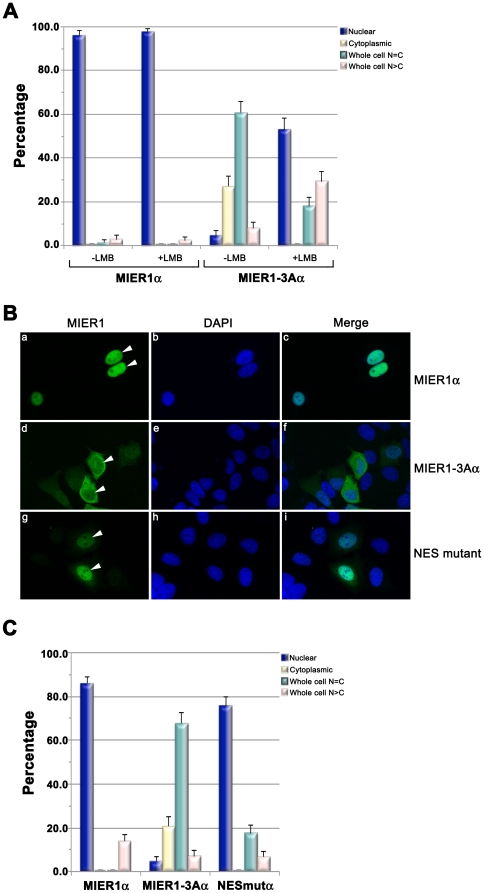
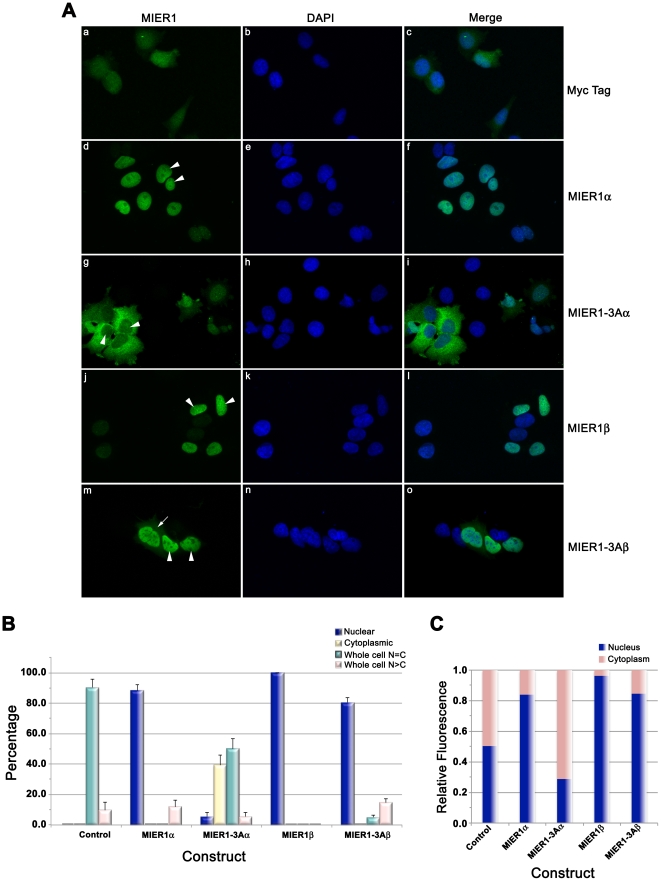
MIER1 was originally identified in a screen for novel fibroblast growth factor activated early response genes. The mier1 gene gives rise to multiple transcripts encoding protein isoforms that differ in their amino (N-) and carboxy (C-) termini. Much of the work to date has focused on the two C-terminal variants, MIER1α and β, both of which have been shown to function as transcriptional repressors. Our previous work revealed a dramatic shift in MIER1α subcellular localization from nuclear in normal breast tissue to cytoplasmic in invasive breast carcinoma, suggesting that loss of nuclear MIER1α may play a role in breast cancer development. In the present study, we investigated whether alternative splicing to include a cassette exon and produce an N-terminal variant of MIER1α affects its subcellular localization in MCF7 breast carcinoma cells. We demonstrate that this cassette exon, exon 3A, encodes a consensus leucine-rich nuclear export signal (NES). Inclusion of this exon in MIER1α to produce the MIER1-3Aα isoform altered its subcellular distribution in MCF7 cells from 81% nuclear to 2% nuclear and this change in localization was abrogated by mutation of critical leucines within the NES. Treatment with leptomycin B (LMB), an inhibitor of the nuclear export receptor CRM1, resulted in a significant increase in the percentage of cells with nuclear MIER1-3Aα, from 4% to 53%, demonstrating that cytoplasmic localization of this isoform was due to CRM1-dependent nuclear export. Inclusion of exon 3A in MIER1β to produce the N-terminal variant MIER1-3Aβ however had little effect on the nuclear targeting of this isoform. Our results demonstrate that alternative splicing to include exon 3A specifically affects the localization pattern of the α isoform.


Conflict of interest statement

Competing Interests: The authors have declared that no competing interests exist.

Figures

Figure 1
Figure 1. Sequence encoded by exon 3A.
(A) Schematic illustrating the 5′end of the mier1 gene and the nucleotide & predicted amino acid sequences of exon 3A. The upper diagram shows the location of exon 3A relative to the 2 promoters, P1& P2. The lower diagram shows the sequence of exon 3A and illustrates alternative splicing to generate either mier1 (exons 2A+4; protein sequence (i)) or mier1-3A (exons 2A+3A+4; protein sequence (ii)). The MIER1 start codon, located at the end of exon 2A, is highlighted yellow, as is a downstream in-frame ‘atg’. For the analysis in (B), both highlighted ATGs were mutated to avoid the possibility of spurious translation initiation at the second ‘atg’; this double mutation changes the putative protein sequence from MLKM to QLKL. The predicted start methionine for MIER1-3A is highlighted in blue; the consensus NES is underlined and the hydrophobic residues are highlighted in green. For the analysis in (B), both the initiation and third codons were changed to produce an MFMF->IFIF mutant. (B) Effect of mutating the putative initiation codons on in vitro translation. 35S-labelled rabbit reticulocyte lysates programmed with wild-type (lane 1) or either of the two mutant mier1-3A cDNAs (lanes 2–3) were immunoprecipitated with anti-MIER1 and analyzed by SDS-PAGE and fluorography; the position of full–length MIER1-3A is indicated by an arrowhead and the molecular weight standards are shown on the left. Mutation of the predicted initiation codon (MFMF->IFIF) located within exon 3A abrogates production of full-length MIER1-3A (lane 2), while mutation of upstream ATGs (MLKM->QLKL) has no effect (lane 3), thus confirming the N-terminal sequence of this isoform. Note that full-length MIER1 proteins migrate aberrantly on SDS-polyacrylamide gels, as has been reported for other proteins containing stretches of acidic residues , .
Figure 2
Figure 2. Subcellular localization of the MIER1α and MIER1-3Aα isoforms in MCF7 cells.
MCF7 cells were transfected with myc-tagged MIER1α, MIER1-3Aα or empty vector and analyzed by immunocytochemistry or immunoblotting with the 9E10 monoclonal antibody. (A) Western blot of extracts from MCF7 cells transfected with empty vector (lane 1), myc-tagged mier1α (lane 2) or myc-tagged mier1-3Aα (lane 3); staining was performed with the 9E10 antibody and confirms that a single protein in each cell extract is recognized by the antibody. The positions of the molecular weight standards are indicated on the left. (B) Histogram showing the results of 3 experiments; random fields were selected and the staining pattern of each cell within the field was scored visually according to the categories described in the Results & Discussion. 650–1,350 cells were scored for each construct. Plotted is the percentage of cells in each category ± S.D. (C) Illustrative examples of the observed staining pattern. Panels (i) & (ii) show brightfield (BF) and the corresponding phase contrast (PhC) views of a staining control, prepared without primary antibody. Panel (iii) shows cells expressing the myc-tag alone; examples of whole cell staining are indicated by arrowheads. Panels (iv) & (v) show cells expressing MIER1-3Aα & MIER1α, respectively; note the absence of nuclear staining in panel (iv) while nuclei in panel (v) are intensely stained (arrows). Scale bar = 50 µm for (i)–(iii) and 25 µm for (iv)–(v).
Figure 3
Figure 3. Function of exon 3A sequence in nuclear export.
(A) Effect of leptomycin B on localization of MIER1α and MIER1-3Aα. Cells were transfected, treated with 5 ng/ml LMB for 24 h and analyzed by confocal microscopy, using DAPI, 9E10 and a DyLight-488 secondary antibody . Histogram showing the results of 2 experiments; the staining pattern from random fields was scored visually according to the categories described in the Results & Discussion. Plotted is the percentage of cells in each category ± S.D; 75–90 cells were scored for each construct with each treatment. Note the increase in nuclear localization in treated cells expressing MIER1-3Aα. (B) and (C) Mutation of the NES consensus increases nuclear localization. MCF7 cells were transfected with plasmids encoding myc-tagged MIER1α, MIER1-3Aα or MIER1-3Aα containing a double mutation in the NES consensus (NES mutant) and analyzed by confocal microscopy using the antibodies described in (A). (B) Illustrative examples of cells expressing MIER1α (a–c), MIER1-3Aα (d–f) or the NES mutant (g–i); arrowheads indicate nuclei. (C) Histogram showing the results of 2 experiments; the staining pattern was scored as in (A). Plotted is the percentage of cells in each category ± S.D; 85–130 cells were scored for each construct.
Figure 4
Figure 4. Subcellular localization of the MIER1-3Aβ isoform in MCF7.
MCF7 cells were transfected with myc-tagged MIER1α, MIER1-3Aα, MIER1β, MIER1-3Aβ or empty vector and analyzed by confocal microscopy, performed as in the legend to Fig. 3. (A) Illustrative examples of cells expressing myc-tag alone (a–c), MIER1α (d–f), MIER1-3Aα (g–i), MIER1β (j–l) or MIER1-3Aβ (m–o). Arrowheads indicate nuclei and the arrow indicates staining in the cytoplasm. (B) Histogram showing the results of 4 independent experiments; the staining pattern was scored as in the legend to Fig. 3. Plotted is the percentage of cells in each category ± S.D; 55–160 cells were scored for each construct. Note that, unlike MIER1-3Aα, MIER1-3Aβ remains predominantly nuclear. (C) Bar graph showing the intracellular distribution of each construct. Pixel values for the nuclear and in the cytoplasmic areas were measured using Image J v1.46 and plotted as a proportion of the total signal. Shown is the proportion in each compartment, using measurements from 30–40 cells for each construct.

References

    1. Paterno GD, Li Y, Luchman HA, Ryan PJ, Gillespie LL. cDNA cloning of a novel, developmentally regulated immediate early gene activated by fibroblast growth factor and encoding a nuclear protein. J Biol Chem. 1997;272:25591–25595. - PubMed
    1. Paterno GD, Mercer FC, Chayter JJ, Yang X, Robb JD, et al. Molecular cloning of human er1 cDNA and its differential expression in breast tumours and tumour-derived cell lines. Gene. 1998;222:77–82. - PubMed
    1. Paterno GD, Ding Z, Lew YY, Nash GW, Mercer FC, et al. Genomic organization of the human mi-er1 gene and characterization of alternatively spliced isoforms: regulated use of a facultative intron determines subcellular localization. Gene. 2002;295:79–88. - PubMed
    1. Thorne LB, Grant AL, Paterno GD, Gillespie LL. Cloning and characterization of the mouse ortholog of mi-er1. DNA Seq. 2005;16:237–240. - PubMed
    1. Post JN, Gillespie LL, Paterno GD. Nuclear localization signals in the Xenopus FGF embryonic early response 1 protein. FEBS Lett. 2001;502:41–45. - PubMed

Publication types

MeSH terms