

Resting-state quantitative electroencephalography reveals increased neurophysiologic connectivity in depression
- PMID: 22384265
- PMCID: PMC3286480
- DOI: 10.1371/journal.pone.0032508
Resting-state quantitative electroencephalography reveals increased neurophysiologic connectivity in depression
Abstract
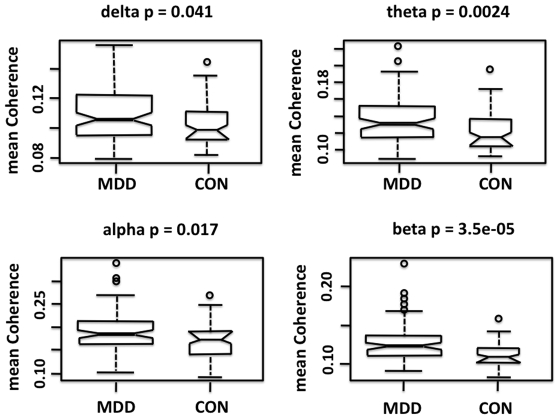
Symptoms of Major Depressive Disorder (MDD) are hypothesized to arise from dysfunction in brain networks linking the limbic system and cortical regions. Alterations in brain functional cortical connectivity in resting-state networks have been detected with functional imaging techniques, but neurophysiologic connectivity measures have not been systematically examined. We used weighted network analysis to examine resting state functional connectivity as measured by quantitative electroencephalographic (qEEG) coherence in 121 unmedicated subjects with MDD and 37 healthy controls. Subjects with MDD had significantly higher overall coherence as compared to controls in the delta (0.5-4 Hz), theta (4-8 Hz), alpha (8-12 Hz), and beta (12-20 Hz) frequency bands. The frontopolar region contained the greatest number of "hub nodes" (surface recording locations) with high connectivity. MDD subjects expressed higher theta and alpha coherence primarily in longer distance connections between frontopolar and temporal or parietooccipital regions, and higher beta coherence primarily in connections within and between electrodes overlying the dorsolateral prefrontal cortical (DLPFC) or temporal regions. Nearest centroid analysis indicated that MDD subjects were best characterized by six alpha band connections primarily involving the prefrontal region. The present findings indicate a loss of selectivity in resting functional connectivity in MDD. The overall greater coherence observed in depressed subjects establishes a new context for the interpretation of previous studies showing differences in frontal alpha power and synchrony between subjects with MDD and normal controls. These results can inform the development of qEEG state and trait biomarkers for MDD.
Conflict of interest statement
Figures
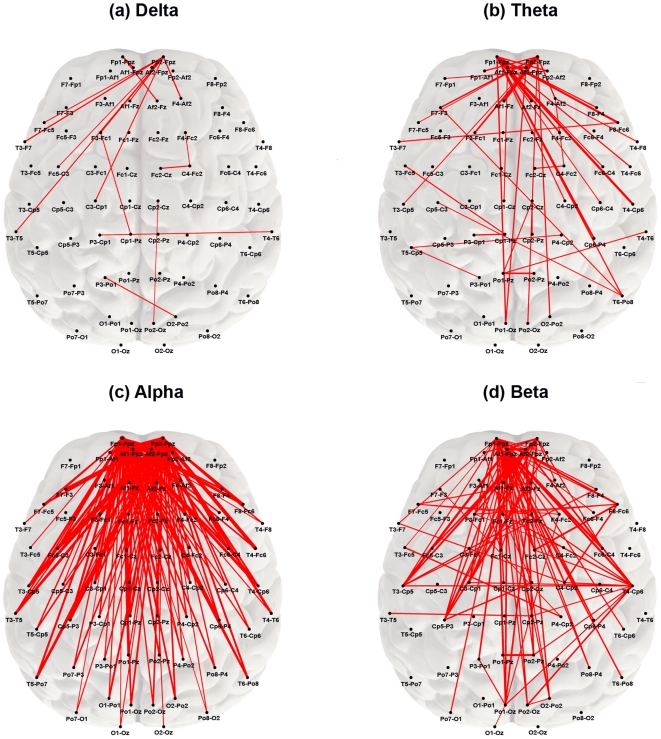
 showing significant differences between groups (by frequency band). Red lines represent connections (edges) whose strength remained significantly different between MDD and control subjects after Bonferroni correction (p≤2.33×10⁻⁵). All red edges represent coherence values that were greater in the MDD group with line thickness proportional to the magnitude of the difference. The nodes most commonly involved in significant edges across frequency bands were located in the prefrontal region.
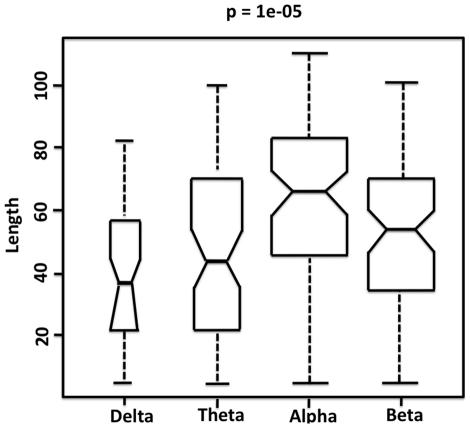
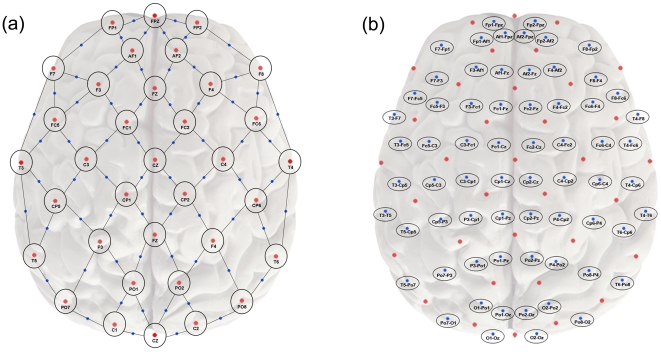
 of connections that showed significant difference between groups (by frequency band). Edge length was determined from the relative physical distance between nodes on a two-dimensional plane as shown in Figure 1B. Edges with significantly different connection strength differed significantly in length across frequency bands (p = 0.00001). Significance level represents the p value for the Kruskal Wallis test examining the equality of the median edge length values between groups. Short horizontal lines within boxes show the median edge length, with notches indicating 95% confidence intervals of the medians. Median edge length was significantly greater for alpha than any other band. The width of the bars is proportional to the number of edges that were significantly different between groups in the frequency band: in the delta band, there were 17 significant edges; in theta, 42; in alpha, 141; and in beta, 121.
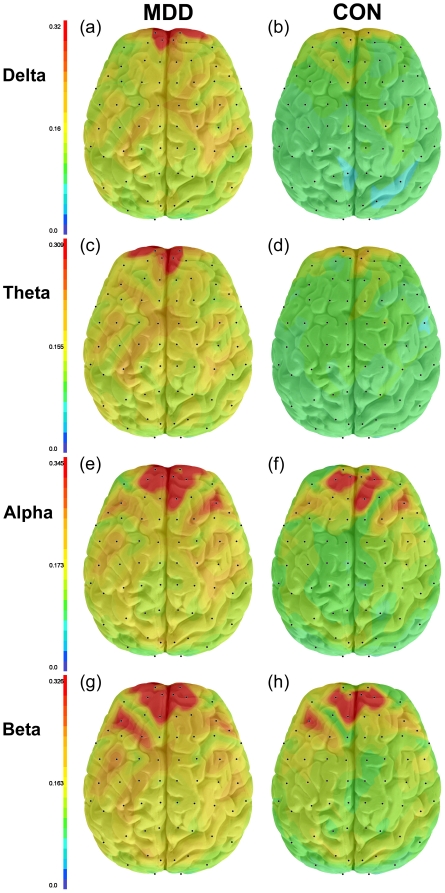
Similar articles
-
Resting-State Quantitative Electroencephalography Demonstrates Differential Connectivity in Adolescents with Major Depressive Disorder.J Child Adolesc Psychopharmacol. 2019 Jun;29(5):370-377. doi: 10.1089/cap.2018.0166. Epub 2019 May 9. J Child Adolesc Psychopharmacol. 2019. PMID: 31038351 Free PMC article.
-
Electroencephalography Source Functional Connectivity Reveals Abnormal High-Frequency Communication Among Large-Scale Functional Networks in Depression.Biol Psychiatry Cogn Neurosci Neuroimaging. 2018 Jan;3(1):50-58. doi: 10.1016/j.bpsc.2017.07.001. Epub 2017 Jul 13. Biol Psychiatry Cogn Neurosci Neuroimaging. 2018. PMID: 29397079 Free PMC article.
-
Neurophysiologic Correlates of Headache Pain in Subjects With Major Depressive Disorder.Clin EEG Neurosci. 2017 May;48(3):159-167. doi: 10.1177/1550059416632411. Epub 2016 Mar 21. Clin EEG Neurosci. 2017. PMID: 27000108
-
Resting state brain network function in major depression - Depression symptomatology, antidepressant treatment effects, future research.J Psychiatr Res. 2017 Sep;92:147-159. doi: 10.1016/j.jpsychires.2017.04.007. Epub 2017 Apr 24. J Psychiatr Res. 2017. PMID: 28458140 Review.
-
Current source density analysis of resting state EEG in depression: a review.J Neural Transm (Vienna). 2017 Feb;124(Suppl 1):109-118. doi: 10.1007/s00702-015-1432-2. Epub 2015 Aug 2. J Neural Transm (Vienna). 2017. PMID: 26233563 Review.
Cited by
-
Negative emotions mediate the association between the topology of the complex brain network and smartphone use disorder: A resting-state EEG study.J Behav Addict. 2024 Feb 6;13(1):120-133. doi: 10.1556/2006.2023.00077. Print 2024 Mar 26. J Behav Addict. 2024. PMID: 38324061 Free PMC article.
-
Modulation of neural oscillations in escitalopram treatment: a Canadian biomarker integration network in depression study.Transl Psychiatry. 2024 Oct 12;14(1):432. doi: 10.1038/s41398-024-03110-8. Transl Psychiatry. 2024. PMID: 39396045 Free PMC article.
-
The Role of Alpha Oscillations among the Main Neuropsychiatric Disorders in the Adult and Developing Human Brain: Evidence from the Last 10 Years of Research.Biomedicines. 2022 Dec 8;10(12):3189. doi: 10.3390/biomedicines10123189. Biomedicines. 2022. PMID: 36551945 Free PMC article. Review.
-
Brain network disintegration as a final common pathway for delirium: a systematic review and qualitative meta-analysis.Neuroimage Clin. 2019;23:101809. doi: 10.1016/j.nicl.2019.101809. Epub 2019 Apr 3. Neuroimage Clin. 2019. PMID: 30981940 Free PMC article.
-
Machine Learning Techniques Reveal Aberrated Multidimensional EEG Characteristics in Patients with Depression.Brain Sci. 2023 Feb 22;13(3):384. doi: 10.3390/brainsci13030384. Brain Sci. 2023. PMID: 36979194 Free PMC article.
References
-
- American Psychiatric Association. Diagnostic and Statistical Manual of Mental Disorders, 4th Edition (DSM-IV-TR) Washington, DC: American Psychiatric Association; 2004.
-
- Joormann J, Dkane M, Gotlib IH. Adaptive and maladaptive components of rumination? Diagnostic specificity and relation to depressive biases. Behav Ther. 2006;37:269–280. - PubMed
-
- Davidson RJ, Pizzagalli D, Nitschke JB, Putnam K. Depression: perspectives from affective neuroscience. Annu Rev Psychol. 2002;53:545–574. - PubMed
-
- Elliott R, Rubinsztein JS, Sahakian BJ, Dolan RJ. The neural basis of mood-congruent processing biases in depression. Arch Gen Psychiatry. 2002;59:597–604. - PubMed
