

Resting-state quantitative electroencephalography reveals increased neurophysiologic connectivity in depression
- PMID: 22384265
- PMCID: PMC3286480
- DOI: 10.1371/journal.pone.0032508
Resting-state quantitative electroencephalography reveals increased neurophysiologic connectivity in depression
Abstract
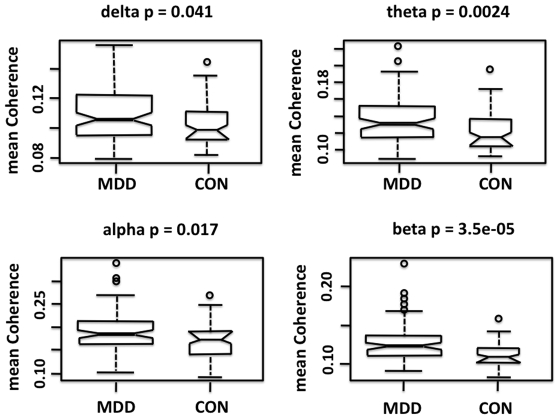
Symptoms of Major Depressive Disorder (MDD) are hypothesized to arise from dysfunction in brain networks linking the limbic system and cortical regions. Alterations in brain functional cortical connectivity in resting-state networks have been detected with functional imaging techniques, but neurophysiologic connectivity measures have not been systematically examined. We used weighted network analysis to examine resting state functional connectivity as measured by quantitative electroencephalographic (qEEG) coherence in 121 unmedicated subjects with MDD and 37 healthy controls. Subjects with MDD had significantly higher overall coherence as compared to controls in the delta (0.5-4 Hz), theta (4-8 Hz), alpha (8-12 Hz), and beta (12-20 Hz) frequency bands. The frontopolar region contained the greatest number of "hub nodes" (surface recording locations) with high connectivity. MDD subjects expressed higher theta and alpha coherence primarily in longer distance connections between frontopolar and temporal or parietooccipital regions, and higher beta coherence primarily in connections within and between electrodes overlying the dorsolateral prefrontal cortical (DLPFC) or temporal regions. Nearest centroid analysis indicated that MDD subjects were best characterized by six alpha band connections primarily involving the prefrontal region. The present findings indicate a loss of selectivity in resting functional connectivity in MDD. The overall greater coherence observed in depressed subjects establishes a new context for the interpretation of previous studies showing differences in frontal alpha power and synchrony between subjects with MDD and normal controls. These results can inform the development of qEEG state and trait biomarkers for MDD.
Conflict of interest statement
Figures
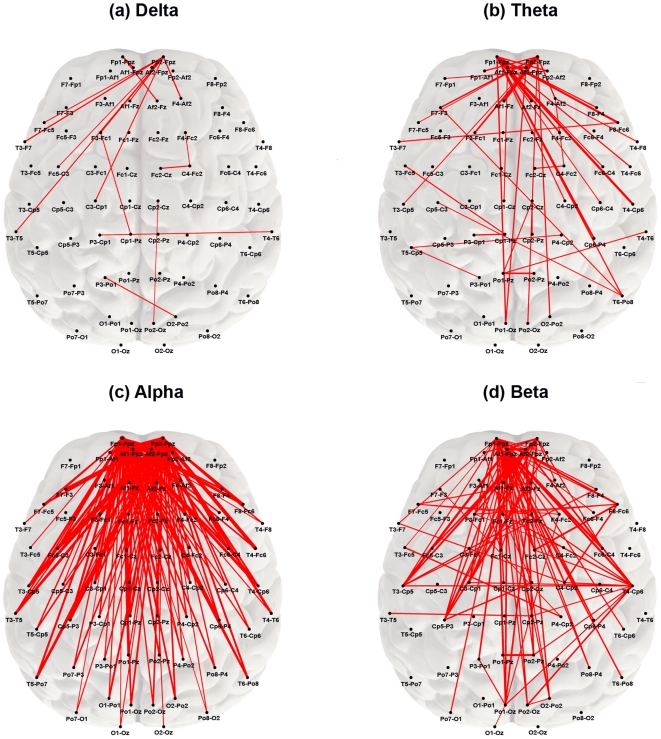
 showing significant differences between groups (by frequency band). Red lines represent connections (edges) whose strength remained significantly different between MDD and control subjects after Bonferroni correction (p≤2.33×10⁻⁵). All red edges represent coherence values that were greater in the MDD group with line thickness proportional to the magnitude of the difference. The nodes most commonly involved in significant edges across frequency bands were located in the prefrontal region.
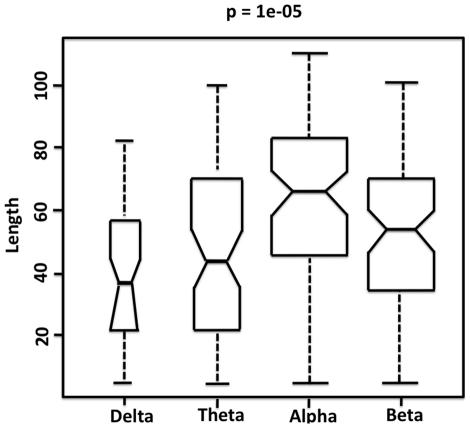
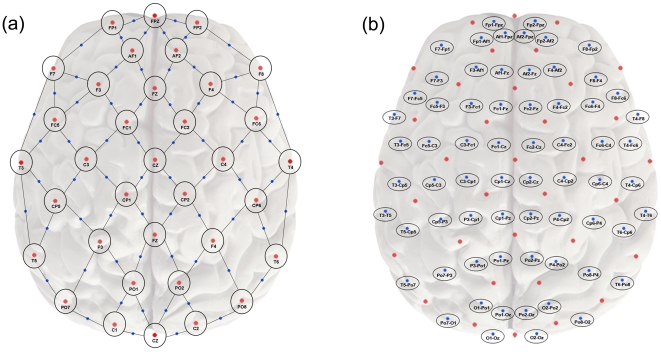
 of connections that showed significant difference between groups (by frequency band). Edge length was determined from the relative physical distance between nodes on a two-dimensional plane as shown in Figure 1B. Edges with significantly different connection strength differed significantly in length across frequency bands (p = 0.00001). Significance level represents the p value for the Kruskal Wallis test examining the equality of the median edge length values between groups. Short horizontal lines within boxes show the median edge length, with notches indicating 95% confidence intervals of the medians. Median edge length was significantly greater for alpha than any other band. The width of the bars is proportional to the number of edges that were significantly different between groups in the frequency band: in the delta band, there were 17 significant edges; in theta, 42; in alpha, 141; and in beta, 121.
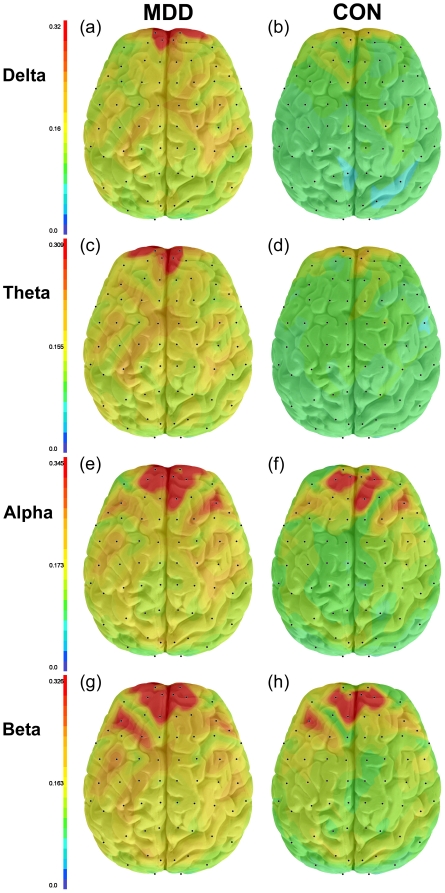
References
-
- American Psychiatric Association. Diagnostic and Statistical Manual of Mental Disorders, 4th Edition (DSM-IV-TR) Washington, DC: American Psychiatric Association; 2004.
-
- Joormann J, Dkane M, Gotlib IH. Adaptive and maladaptive components of rumination? Diagnostic specificity and relation to depressive biases. Behav Ther. 2006;37:269–280. - PubMed
-
- Davidson RJ, Pizzagalli D, Nitschke JB, Putnam K. Depression: perspectives from affective neuroscience. Annu Rev Psychol. 2002;53:545–574. - PubMed
-
- Elliott R, Rubinsztein JS, Sahakian BJ, Dolan RJ. The neural basis of mood-congruent processing biases in depression. Arch Gen Psychiatry. 2002;59:597–604. - PubMed
