. 2012;7(2):e32609.
doi: 10.1371/journal.pone.0032609. Epub 2012 Feb 27.

Preventing phosphorylation of sterol regulatory element-binding protein 1a by MAP-kinases protects mice from fatty liver and visceral obesity

Affiliations

Preventing phosphorylation of sterol regulatory element-binding protein 1a by MAP-kinases protects mice from fatty liver and visceral obesity

Jorg Kotzka et al. PLoS One. 2012.

Abstract

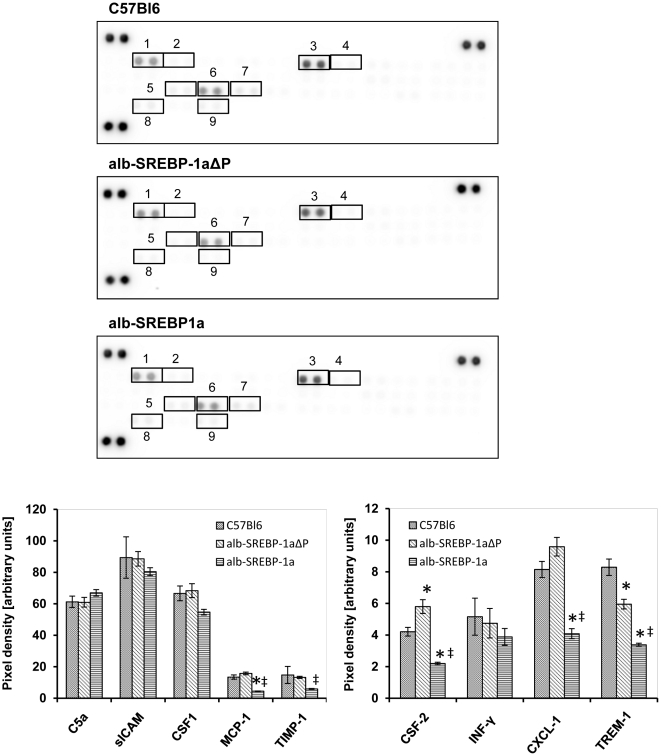
The transcription factor sterol regulatory element binding protein (SREBP)-1a plays a pivotal role in lipid metabolism. Using the SREBP-1a expressing human hepatoma cell line HepG2 we have shown previously that human SREBP-1a is phosphorylated at serine 117 by ERK-mitogen-activated protein kinases (MAPK). Using a combination of cell biology and protein chemistry approach we show that SREBP-1a is also target of other MAPK-families, i.e. c-JUN N-terminal protein kinases (JNK) or p38 stress activated MAP kinases. Serine 117 is also the major phosphorylation site in SREBP-1a for JNK. In contrast to that the major phosphorylation sites of p38 MAPK family are serine 63 and threonine 426. Functional analyses reveal that phosphorylation of SREBP-1a does not alter protein/DNA interaction. The identified phosphorylation sites are specific for both kinase families also in cellular context. To provide direct evidence that phosphorylation of SREBP-1a is a regulatory principle of biological and clinical relevance, we generated transgenic mice expressing mature transcriptionally active N-terminal domain of human SREBP-1a variant lacking all identified phosphorylaton sites designed as alb-SREBP-1aΔP and wild type SREBP-1a designed as alb-SREBP-1a liver specific under control of the albumin promoter and a liver specific enhancer. In contrast to alb-SREBP-1a mice the phosphorylation-deficient mice develop no enlarged fatty livers under normocaloric conditions. Phenotypical examination reveales a massive accumulation of adipose tissue in alb-SREBP-1a but not in the phosphorylation deficient alb-SREBP-1aΔP mice. Moreover, preventing phosphorylation of SREBP-1a protects mice also from dyslipidemia. In conclusion, phosphorylation of SREBP-1a by ERK, JNK and p38 MAPK-families resembles a biological principle and plays a significant role, in vivo.


Conflict of interest statement

Competing Interests: The authors have declared that no competing interests exist.

Figures

Figure 1
Figure 1. Identification of S117 as major JNK related phosphorylation site in SREBP-1a.
(A) 10 µg GST-SREBP-1a-NT and GST-SREBP-1a-NT S117A were phosphorylated by activated recombinant JNK1 or JNK2 (40 ng/µg protein) or recombinant p38 isoforms p38α, p38β, p38γ (40 ng/µg protein) in vitro and separated by 10% SDS-PAGE. A coomassie blue stained gel (left), autoradiography of SDS-PAGE of JNK1, JNK2, p38α, p38β or p38γ phosphorylation is shown. The arrow marks band of SREBP-1a. The excised radioactive slices of GST-SREBP-1a-NT or GST-SREBP-1a-NT S117A phosphorylated by JNK1 (B) or phosphorylated by p38α (C) were digested by trypsin and the resulting peptides were subjected to anion exchange chromatography. The graph shows the elution fraction plotted against the incorporated radioactivity. Reactions performed are described under “Materials and Methods”.
Figure 2
Figure 2. Identification of p38 specific phosphorylation sites in SREBP-1a-NT.
(A) 500 µg GST-SREBP-1a-NT were phosphorylated by p38α (40 ng/µg protein). Following 10% SDS-PAGE and in-gel trypsin digestion of phosphorylated SREBP-1a-NT, the resulting peptides were fractionated by reverse-phase HPLC on a C18 column. Peptides were eluted with a 0–95% linear gradient of acetonitrile in 0.1% trifluoroacetic acid. The eluate was monitored by UV absorbance at 215 nm. Radioactive fractions are marked with asterisks. (B) The HPLC fraction 1, containing radiolabeled peptide, was analyzed by MALDI-MS in the linear positive-ion mode and lead to identification of a (M+H)+ peptide having a m/z of 2952.35 Da. MALDI-PSD analyses using this peptide ion as mass parent ion. Fragmentation mass spectrum of (M+H)+ peptide with identified internal b- and y-fragment ions are designated. The interpretation of PSD fragment data allowed identification of the above-designated peptide (TEVEDTLT *PPPSDAGSPFQSSPLSLGSR) (aa 419–446) with phosphorylated T426. (C) 10 µg GST-SREBP-1a-NT and GST-SREBP-1a-NT S63A, GST-SREBP-1a-NT S98A or GST-SREBP-1a-NT T105V were phosphorylated by activated recombinant p38 isoforms p38α, p38β, p38γ (40 ng/µg protein) in vitro and separated by 10% SDS-PAGE. A coomassie blue stained gel (left-hand side) and an autoradiography (right-hand side) of SDS-PAGE of p38α, p38β or p38γ phosphorylation are shown. The arrow marks the band of SREBP-1a. (D) The excised radioactive slices of GST-SREBP-1a-NT, GST-SREBP-1a-NT S63A, GST-SREBP-1a-NT S98A, or GST-SREBP-1a-NT T105V phosphorylated by p38α were digested by trypsin and the resulting peptides were subjected to anion exchange chromatography. The graph shows the elution fraction plotted against the incorporated radioactivity. Reactions performed are described under “Materials and Methods”.
Figure 3
Figure 3. Verification of p38 specific phosphorylation sites in SREBP-1a-NT.
(A) Coomassie brilliant blue stained SDS-PAGE of GST-SREBP-1a-NT and each of mutated SREBP-1a-NT phosphorylated by activated recombinant p38α (40 ng/µg protein). (B) Autoradiography of SDS-PAGE of GST-SREBP-1a-NT fusion protein, single mutated forms S63A, T426V or double mutant GST-SREBP-1a-NT S63A/T426V phosphorylated by activated recombinant p38α. Excised radioactive slices of p38α phosphorylated recombinant proteins were trypsin-digested and the resulting peptides GST-SREBP-1a-NT, S63A, T426V or double mutant S63A/T426V, as indicated in the figure, were subjected to anion exchange chromatography. Elution was performed with a KH2PO4 pH 4 buffer gradient. Reactions performed are described under “Materials and Methods”. (C) Autoradiography of SDS-PAGE of GST-SREBP-1a-NT fusion protein, single mutated forms S63A, T426V or double mutant GST-SREBP-1a-NT S63A/T426V phosphorylated by activated recombinant p38β or p38γ (40 ng/µg protein).
Figure 4
Figure 4. Effect of phosphorylation on DNA binding and acitvity of SREBP-1a in vitro.
(A) His-SREBP-1a-NT fusion protein was incubated with or without JNK1 (40 ng/µg protein) as indicated. An EMSA of His-SREBP-1a-NT incubated with sre-1 fragment (upper panel) or E-box fragment (lower panel) is shown. To confirm equal loading, western-blot analyses with monoclonal anti-HisG-HRP antibody was performed. To control phosphorylation efficiency a JNK1 kinase assay with (γ32P) ATP was performed and dried SDS-PAGE was exposed to X-ray film. For further details see “Materials and Methods”. (B) His-SREBP-1a-NT fusion protein was incubated with or without p38α (40 ng/µg protein) as indicated. An EMSA of His-SREBP-1a-NT incubated with sre-1 fragment (upper panel)or E-box fragment (lower panel) is shown. To confirm equal loading, western-blot analysis with monoclonal anti-HisG-HRP antibody were performed. To control phosphorylation efficiency a p38α kinase assay with (γ32P) ATP was performed and dried SDS-PAGE was exposed to X-ray film. For further details see “Materials and Methods”.
Figure 5
Figure 5. Effect of phosphorylation on DNA binding and acitvity of SREBP-1a.
HepG2 cells were transiently transfected with pG5-luc (0.5 µg/well) and pFA-SREBP-1a-NT or the mutants S117A, S63A/T426V, S63A/S117A/T426V (25 ng/well) in the presence 25 ng/well MKK3DE and MKK4DE, respectively as indicated. Cells were maintained for 16 h before harvesting and analyses of dual luciferase activity. Transfection efficiency was controlled by co-transfection of pRL(-mcs)-vector (0.1 µg/well). Promoter strength of the LDL receptor gene is represented by the relative luciferase activities. Results are given as means (±S.D.) of five independent experiments, each performed in triplicate (p<0.01).
Figure 6
Figure 6. Liver specific overexpression of HA-SREBP-1aΔP and HA-SREBP-1a in vivo.
(A) Scheme of the DNA constructs used to generate transgenic mice. The transcriptional active N-terminal domain of the phosphorylation mutant of the human SREBP-1a, SREBP-1aΔP, or the human SREBP-1a gene were inserted into a vector construct containing the mouse albumin promoter and a liver specific enhancer element next to a HA-Tag and a polyadenylation site. Constructs only differ in three aminoacids, i.e. the MAPK phosphorylation sites S63, S117 and T426 that have been mutated to S63A, S117A and T426V as indicated in the scheme. (B) Verification of transgene insertion into genomic DNA by PCR. M: marker, genomic DNA of lane 1: C57Bl6, 2: alb-SREBP-1aΔP, 4: C57Bl6, 5: alb-SREBP-1a, lane 3 and 6: no template controls. (C) Validation of transgene expression on mRNA level by RT-PCR. RNA extracted from snapp frozen liver biopsies from male alb-SREBP-1aΔP, alb-SREBP-1a or C57Bl6 mice were analyzed by RT-PCR with transgene human HA-SREBP-1a, mouse SREBP-1a, mouse SREBP-1c and mouse SREBP-2 specific primers and probe. The relative RNA amount shown in arbitrary units was calculated and plotted ± SD. Graphs represent data from ten male mice per genotype, each analyzed in triplicate (p<0.01). (D) Verification of transgene expression on protein level in liver. Protein extracts of snap frozen liver biopsies from lane 1: SREBP-1aΔP, 2: alb-SREBP-1a, and 3: C57Bl6 mice were separated by SDS-PAGE and blotted on nitrocellulose membrane. Membranes were probes with SREBP-1 specific antibodies to determine SREBP-1 precursor protein (K10, SantaCruz) and total nuclear SREBP-1 (H160, SantaCruz) contend. To determine the HA-tag of the transgene construct membrabes were probed with HA-specific antibody. For normalizing blots were probed with α-tubulin antibody. A representative experiment is shown. (E) Graphs show densitometry evaluation for SREBP-1 precursor, nuclear SREBP-1 contend and the transgenic HA-SREBP-1a construct of n = 5 independent experiments with the levels determined for SREBP-1aΔP set as 100%. Tissue specific expression of alb-SREBP-1aΔP (F) and alb-SREBP-1a (G). Protein extracts of lane 1: liver, 2: pancreas, 3: heart, 4: kidney, 5: small intestine and 6: skeletal muscle, were separated by SDS-PAGE, blotted and probed with HA-specific antibody. A representative experiment is shown. The arrow indicates HA-tagged SREBP-1a.
Figure 7
Figure 7. Weight gain and Food intake of C57Bl6, alb-SREBP-1aΔP and alb-SREBP-1a transgenic animals.
Male C57Bl6, alb-SREBP-1aΔP and alb-SREBP-1a mice (n = 20 per genotype) were housed as groups of four under standard conditions with unlimited access to water and regular chow (13.0 MJ/kg: 53% carbohydrates, 11% fat, 36% protein). Weight gain (A) and Food intake (B) were measured once a week starting at weaning and monitored for an observation period of 18 weeks. Body weight (C), liver weight ((D) and WAT weight (E) were determined at sacrification. WAT contend per body weight (F), food uptake per body weight and (G) weight gain per food uptake (H) were determined in each group of mice. Data are given as means including standard deviation (±SD).
Figure 8
Figure 8. Macroscopic and histological comparison of livers from C57Bl6, alb-SREBP-1aΔP and alb-SREBP-1a mice.
Male mice of each genotype (C57Bl6, alb-SREBP1aΔP, alb-SREBP-1a (n = 20 per genotype)) were housed as groups of 4 under standard conditions with unlimited access to water and regular chow (13.0 MJ/kg: 53% carbohydrates, 11% fat, 36% protein). (A) Livers of a C57Bl6 mouse (left), alb-SREBP-1aΔP (middle) or alb-SREBP-1a (right). All photographs were taken with the same magnification. (B) Liver tissue of the Lobus caudatus, Lobus sinister- and Lobus dexter lateralis were fixed in 4% paraformaldehyd/PBS and embedded in paraffin with automated standard histological procedures. (I) Standard hematoxylin and eosin staining was performed on 3 µm deparaffinized sections. (II) PAS staining was performed to determine glycogen contend. (III) The tissues were also used for cryofixation and Oil-red-O staining was used for lipid visualization. (IV) Fibers and extra cellular matrix were visualized using the “van Gierson kit” to determine tissue integrity. The overview magnification is 1∶10 and details are shown in 1∶80 magnification.
Figure 9
Figure 9. Macroscopic and comparison of C57Bl6, alb-SREBP-1aΔP and alb-SREBP-1a mice.
(A) Male C57Bl6, alb-SREBP1aΔP and alb-SREBP-1a (n = 20 per genotype) were housed as groups of four under standard isocaloric conditions with unlimited access to water and regular chow (13.0 MJ/kg: 53% carbohydrates, 11% fat, 36% protein). Panels show a ventral view of C57Bl6, alb-SREBP-1aΔP and alb-SREBP1a mice. (B) For histological overview standard hematoxylin and eosin staining was performed on 3 µm deparaffinized sections of WAT. All photographs are in same magnification.
Figure 10
Figure 10. Phosphorylation of SREBP-1a influences fatty acid composition of liver and serum.
In liver tissues the composition total fatty acid (TFA) (A) and in serum samples of the same animals the composition of free fatty acid (FFA) (B) of C57Bl6, alb-SREBP1aΔP as well as alb-SREBP-1a transgenic animals was determined by GC analyses. Data were calculated as percent of in TFA or FFA. The graphs indicate the percental difference the values determined for alb-SREBP-1aΔP and alb-SREBP-1a mice to C57Bl6 mice. Data are given as means including standard deviation (±SD) of (n = 20) replicates per genotype (*p<0.01: alb-SREBP-1aΔP or alb-SREBP-1a vs. C57Bl6; ‡p<0.01: alb-SREBP-1aΔP vs. alb-SREBP-1a).
Figure 11
Figure 11. Phosphorylation of SREBP-1a influences systemic insulin sensitivity.
Surrogate indexes were calculated from fasting blood glucose and plasma insulin concentrations as follows: QUICKI = 1/(log(I0)+log(G0)), where I0 is fasting insulin (µU/ml) and G0 is fasting glucose (mg/dl); and HOMA-IR = (G0 * I0)/22.5, with fasting glucose expressed as mmol/l and fasting insulin expressed as µU/ml. Data are given as box plot analyses (n = 20). ANOVA significance p<0.05 is indicated by an asterisks.
Figure 12
Figure 12. Phosphorylation of SREBP-1a influences serum cytokine profile.
The cytokine content in serum was analyzed using the Proteome Profiler™; R&D Systems, (Abingdon, UK). Spot intensities were normalized to background and positive controls set to 100% intensity. Presented numbers on membranes mark targets as follows: (1) C5a; (2) CSF-3; (3) sICAM; (4) INF-γ; (5) IL-12-p70; (6) CXCL-1; (7) CSF-1; (8) MCP-1; (9) Timp-1; (10) Trem-1. Abundance of: CXCL13, CSF-2, CCL-1, CCL-11, IL1-α, IL1-ß, IL-1ra, IL-2, IL-3, IL-4, IL-5, IL-6, IL-7, IL-10, IL-13, IL-16, IL-17, IL-23, IL-27, CXCL-10, CXCL-11, MCP-5, CXCL-9, CCR-1a, CCL-4, CCL-2, CCL5, CXCL-12, CCL-17 or TNF-α was not detected in serum. (1) CSF-3; (2) GM-CSF CSF-2; (3) CCL-1; (4) sICAM -; (5) IL-1ra; (6) IL-6; (7) CXCL-10; (8) CXCL-1; (9) CSF-1; (10) MCP-1; (11) CXCL-9; (12) MCP-5; (13) CCR-1a; (14) CXCL-2; (15) CCL-5; (16) Timp-1. Abundance of: CXCL-13, C5a, CCL-11, IFN-γ, IL1-α, IL1-ß, IL-2, IL-3, IL-4, IL-5, IL-7, IL-10, IL-13, IL-12-p70, IL-16, IL-17, IL-23, IL-27, CXCL-11, CCL-4, CXCL-12, CCL-17, TNF-α or Trem-1 was not detected. Data are given as means ± S.D. (n = 6, each) of normalized intensity. Significance was calculated by 2-way ANOVA. (C57Bl6 vs. alb-SREBP-1a or alb-SREBP-1aΔP mice: *p<0.001; alb-SREBP-1aΔP vs. alb-SREBP-1a mice: ‡p<0.001.)

Similar articles

Cited by

References

    1. Brown MS, Goldstein JL. Cholesterol feedback: from Schoenheimer's bottle to Scap's MELADL. J Lipid Res. 2009;50:S15–27. - PMC - PubMed
    1. Yokoyama C, Wang X, Briggs MR, Admon A, Wu J, et al. SREBP-1, a basic-helix-loop-helix-leucine zipper protein that controls transcription of the low density lipoprotein receptor gene. Cell. 1993;75:187–197. - PubMed
    1. Shimomura I, Shimano H, Horton JD, Goldstein JL, Brown MS. Isoform 1c of Sterol Regulatory Element Binding Protein Is Less Active Than Isoform 1a in Livers of Transgenic Mice and in Cultured Cells. J Clin Invest. 1997;99:838–845. - PMC - PubMed
    1. Horton JD, Goldstein JL, Brown MS. SREBPs: activators of the complete program of cholesterol and fatty acid synthesis in the liver. J Clin Invest. 2002;109:1125–1131. - PMC - PubMed
    1. Shimano H, Horton JD, Shimomura I, Hammer RE, Brown MS, et al. Isoform 1c of sterol regulatory element binding protein is less active than isoform 1a in livers of transgenic mice and in cultured cells. J Clin Invest. 1997;99:846–854. - PMC - PubMed

Publication types

Substances