. 2011 Jul;1(2):93-103.
doi: 10.1534/g3.111.000349. Epub 2011 Jul 1.

Translational Genomics in Legumes Allowed Placing In Silico 5460 Unigenes on the Pea Functional Map and Identified Candidate Genes in Pisum sativum L

Translational Genomics in Legumes Allowed Placing In Silico 5460 Unigenes on the Pea Functional Map and Identified Candidate Genes in Pisum sativum L

Amandine Bordat et al. G3 (Bethesda). 2011 Jul.

Abstract

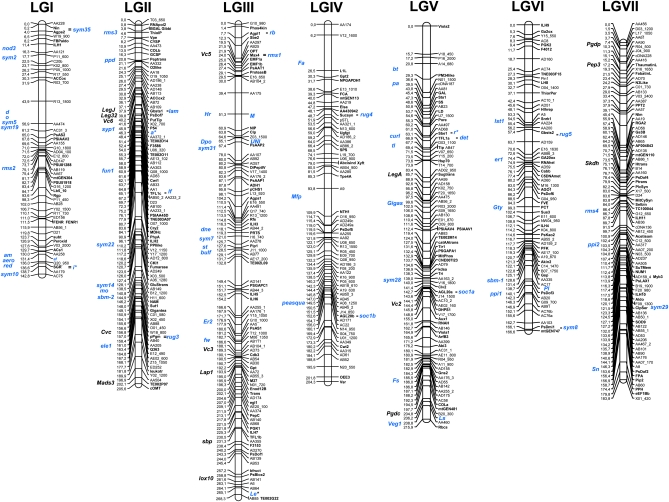
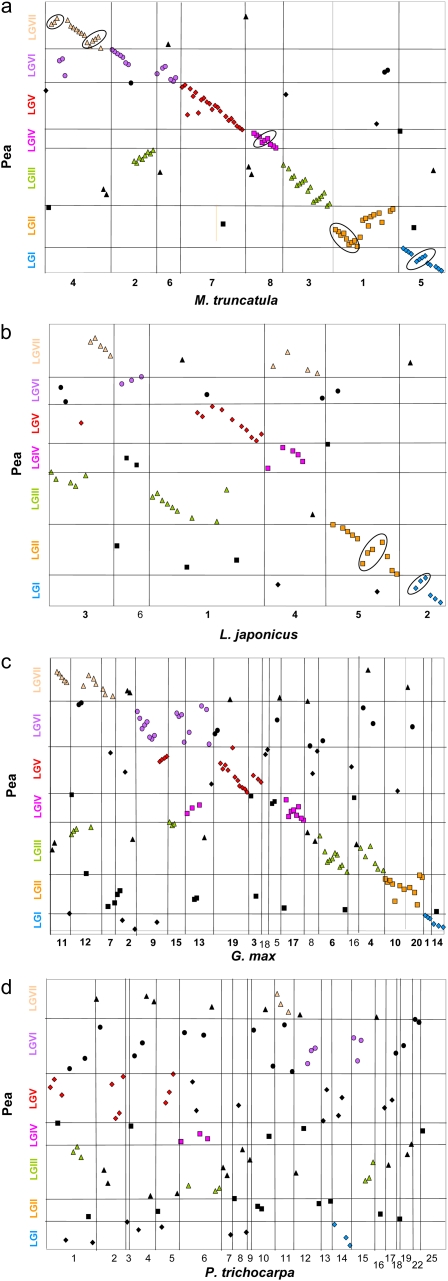
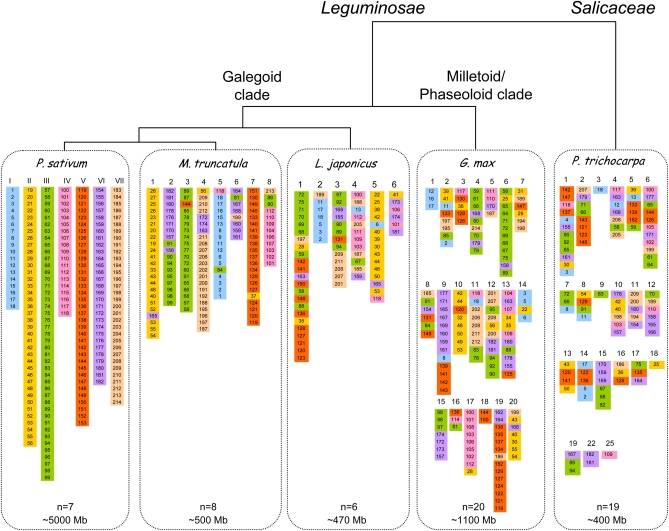
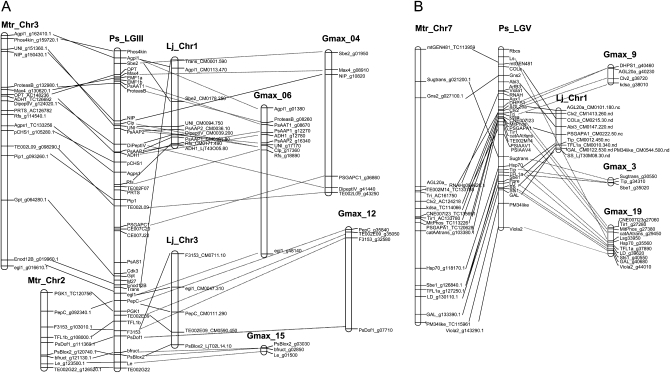
To identify genes involved in phenotypic traits, translational genomics from highly characterized model plants to poorly characterized crop plants provides a valuable source of markers to saturate a zone of interest as well as functionally characterized candidate genes. In this paper, an integrated view of the pea genetic map was developed. A series of gene markers were mapped and their best reciprocal homologs were identified on M. truncatula, L. japonicus, soybean, and poplar pseudomolecules. Based on the syntenic relationships uncovered between pea and M. truncatula, 5460 pea Unigenes were tentatively placed on the consensus map. A new bioinformatics tool, http://www.thelegumeportal.net/pea_mtr_translational_toolkit, was developed that allows, for any gene sequence, to search its putative position on the pea consensus map and hence to search for candidate genes among neighboring Unigenes. As an example, a promising candidate gene for the hypernodulation mutation nod3 in pea was proposed based on the map position of the likely homolog of Pub1, a M. truncatula gene involved in nodulation regulation. A broader view of pea genome evolution was obtained by revealing syntenic relationships between pea and sequenced genomes. Blocks of synteny were identified which gave new insights into the evolution of chromosome structure in Papillionoids and Eudicots. The power of the translational genomics approach was underlined.

Keywords: Pisum sativum; functional consensus map; model legume species; synteny; translational genomics.


Figures

Figure 1
Figure 1
The new Pisum sativum L. consensus functional map. Gene markers are in bold on the right of linkage groups. Known mutations and protein or gene markers placed according to previous maps (Laucou et al. 1998; Hall et al. 1997; Weeden et al. 1998; Ellis and Poyser 2002; Wang et al. 2008; Sinjushin et al. 2006; Mishra et al. 2009; Li et al. 2010) are in bold on the left of linkage groups. Known mutations are in blue type. *Mendel’s genes.
Figure 2
Figure 2
Dot-plots of syntenic relationships between the P. sativum linkage groups (LG) and M. truncatula (a), L. japonicus (b), G. max (c), and P. trichocarpa (d) pseudo-chromosomes. The best reciprocal homologs are placed on the dot-plot according to their position on the pea LG (Y-axis) and their position on the pseudo-chromosomes (x-axis). Synteny conservation is evidenced when homologs symbols are placed on diagonal lines. Rearrangements are circled. Syntenic blocks are highlighted according to pea LG (blue diamonds: gene mapped on PsI; yellow squares: PsII; green triangles: PsIII; pink squares: PsIV; red diamonds: PsV; purple circles: PsVI; pink triangles: LGVII); symbols are color-coded when at least three best reciprocal homologs are found between a pea LG and M. truncatula, L .japonicus, G. max, or P. trichocarpa pseudo-chromosomes.
Figure 3
Figure 3
Summary view of P. sativum, M. truncatula, L. japonicus, soybean (G. max), and poplar (P. trichocarpa) genomes, phylogenetic relationships, and molecular characteristics. Genomes are depicted through best reciprocal homogue genes, color-coded and numbered according to the position of the P. sativum homolog on linkage groups of the consensus functional map.
Figure 4
Figure 4
Comparative maps between P. sativum and M. truncatula, L. japonicus, soybean for (A) LGII and (B) LGV.
Figure 5
Figure 5
Pea genome paleo-history. The pea genome (bottom) is represented with a seven-color code to illuminate the evolution of segments from a common ancestor with seven chromosomes (A1–A7, top). Colored lines indicate the evolution of segments from a seven-chromosome common ancestor of the Eudicots to reach the modern pea genome structure. The 25 chromosomal fusions (CF) are highlighted with colored arrows. At the bottom of the figure is shown the actual pea genome structure. The ancestral shared duplications can be compared with the seven ancestral paleo-triplications reported in grape (Vitis vinifera, Abrouk et al. 2010): V. vinifera chromosomes are indicated by Vv, P. sativum linkage groups by Ps. 1Vv1-Vv14-Vv17/ PsIII-PsIV-PsV-PsVI-PsVII (yellow), Vv2-Vv12-Vv15-Vv16/PsI-PsII-PsV-PsVII (blue), Vv3-Vv4-Vv7-Vv18/PsI-PsII-PsIII-PsVII (green), Vv4-Vv9-Vv11/PsII-PsIII-PsIV-PsVI (light blue), Vv5-Vv7-Vv14/PsII-PsV (pink), Vv6-Vv8-Vv13/PsII-PsV-PsVII (brown), Vv10-Vv12-Vv19/PsI-PsIII-PsIV-PsVI-PsVII (red).

References

    1. Abrouk M., Murat F., Pont C., Messing J., Jackson S., et al. , 2010. Palaeogenomics of plants: synteny-based modelling of extinct ancestors. Trends Plant Sci. 15: 479–487 - PubMed
    1. Aubert G., Morin J., Jacquin J., Loridon K., Quillet M. C., et al. , 2006. Functional mapping in pea, as an aid to the candidate gene selection and for investigating synteny with the model legume Medicago truncatula. Theor. Appl. Genet. 112: 1024–1041 - PubMed
    1. Blixt S., 1972. Mutation genetics in Pisum. Agri. Hort. Genet. 30: 1–293
    1. Burstin J., Marget P., Huart M., Moessner A., Mangin B., et al. , 2007. Developmental genes have pleiotropic effects on plant morphology and source capacity, eventually impacting on seed protein content and productivity in pea. Plant Physiol. 144: 768–781 - PMC - PubMed
    1. Cannon S. B., Sterck L., Rombauts S., Sato S., Cheung F., et al. , 2006. Legume genome evolution viewed through the Medicago truncatula and Lotus japonicus genomes. Proc. Natl. Acad. Sci. USA 103: 14959–14964 - PMC - PubMed

LinkOut - more resources