. 2011 Sep;1(4):263-81.
doi: 10.1534/g3.111.000422. Epub 2011 Sep 1.

Deciphering the molecular basis of wine yeast fermentation traits using a combined genetic and genomic approach

Deciphering the molecular basis of wine yeast fermentation traits using a combined genetic and genomic approach

Chloé Ambroset et al. G3 (Bethesda). 2011 Sep.

Abstract

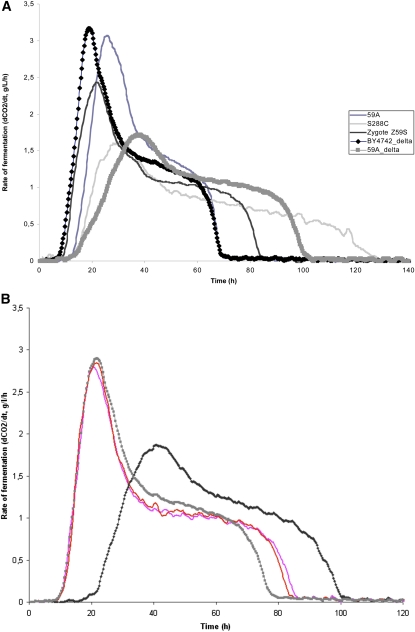
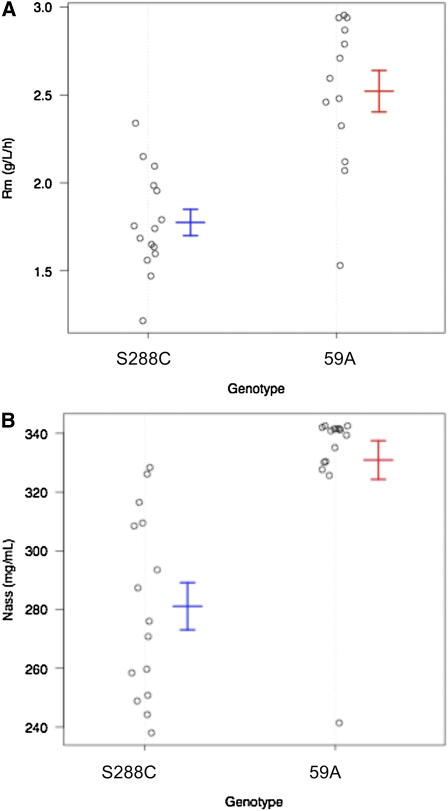
The genetic basis of the phenotypic diversity of yeast is still poorly understood. Wine yeast strains have specific abilities to grow and ferment under stressful conditions compared with other strains, but the genetic basis underlying these traits is unknown. Understanding how sequence variation influences such phenotypes is a major challenge to address adaptation mechanisms of wine yeast. We aimed to identify the genetic basis of fermentation traits and gain insight into their relationships with variations in gene expression among yeast strains. We combined fermentation trait QTL mapping and expression profiling of fermenting cells in a segregating population from a cross between a wine yeast derivative and a laboratory strain. We report the identification of QTL for various fermentation traits (fermentation rates, nitrogen utilization, metabolites production) as well as expression QTL (eQTL). We found that many transcripts mapped to several eQTL hotspots and that two of them overlapped with QTL for fermentation traits. A QTL controlling the maximal fermentation rate and nitrogen utilization overlapping with an eQTL hotspot was dissected. We functionally demonstrated that an allele of the ABZ1 gene, localized in the hotspot and involved in p-aminobenzoate biosynthesis, controls the fermentation rate through modulation of nitrogen utilization. Our data suggest that the laboratory strain harbors a defective ABZ1 allele, which triggers strong metabolic and physiological alterations responsible for the generation of the eQTL hotspot. They also suggest that a number of gene expression differences result from some alleles that trigger major physiological disturbances.

Keywords: QTL; fermentation; p-aminobenzoate; transcriptome; wine yeast.


Figures

Figure 1
Figure 1
Fermentation profiles of industrial and laboratory strains. Fermentation rate profiles of the industrial wine yeast EC1118 (gray squares), its haploid derivative 59A (black diamonds), the laboratory strain S288C (gray line), and the hybrid Z59S (black line).
Figure 2
Figure 2
Principal component analysis (PCA) of kinetic and metabolic traits. This analysis shows that all kinetic parameters are correlated. The first component shows that Nass and fermentation rates (Rmax, R50, R70) are negatively correlated with Fd. The second component shows that Cp is not correlated with the other parameters.
Figure 3
Figure 3
QTL mapping of kinetics traits and succinate production. The concatenated chromosomes are displayed on the X-axis and LOD score values on the Y-axis. The significant LOD score thresholds are indicated by a red line. Each peak of the LOD curve corresponds to the LOD value of linkage between a marker located in the X position and the value of each trait. Further details of QTL are in Table 2.
Figure 4
Figure 4
Genomic view of eQTL distribution and relationships with QTL for fermentation traits. A) Genomic view of eQTL mapping. The X-axis represents the genome location of markers, and the Y-axis represents the genome location of the regulated linked genes on concatenated chromosomes. EQTL values with LOD scores greater than 3.5 are displayed. The diagonal pattern is called “cis-eQTL band” and represents an association between the expression level of a gene and the genotype at the gene’s locus. Multiple vertical bands, called “trans-eQTL bands,” illustrate associations between the expression of many genes and a single locus. B) Overlapping of eQTL and QTL for fermentation traits. The scale below the figure indicates the genomic position across the genome in mega base pairs (Mpb). We can observe the overlapping of the hotspot on chromosome II with Fd, R70, R50, and succinate (succ) parameters and the overlap of the hotspot located on chromosome XIV with Rmax and Nass. QTL for traits with LOD scores just below the threshold are shown in blue.
Figure 5
Figure 5
Reciprocal hemizygous analysis of ABZ1 and impact of p-aminobenzoate on the fermentation profiles. A) Fermentation rate profiles of the two reciprocal hemizygous strains carrying the ABZ1 allele from BY4742 or 59A. The hemizygous strains harbor either an active ABZ1 BY allele (strain BY4742/ABZ1-59A∆, thick gray line) or the 59A allele (strain 59A/ABZ1- BY4742∆, black line with diamonds). Profiles of the strains 59A (dark-blue line), the laboratory strain S288C (thin gray line), and the hybrid Z59S (black line) are shown. B) Impact of p-aminobenzoate on the fermentation profiles of hemizygous strains. Fermentation kinetics of two hemizygous strains in MS300 supplemented or not with 1 mg/l of p-aminobenzoic acid. Hemizygous strain carrying S288c ABZ1 allele in MS300 without (black line) or supplemented with p-aminobenzoic acid (gray kinetic line). Hemizygous strain carrying 59A ABZ1 allele in MS300, without (red kinetic line) or supplemented with p-aminobenzoic acid (pink kinetic line). The supplementation with p-aminobenzoic acid improves the fermentation capacity of the hemizygous strain carrying the S288c ABZ1 allele.
Figure 6
Figure 6
Impact of the ABZ1 genotype on the fermentation phenotypes Rmax and Nass of the 30 segregants. A) Fermentation rate Rmax of the segregants that inherited the ABZ1 locus from S288C or 59A. B) Nitrogen assimilation (Nass) phenotype of the segregants that inherited the ABZ1 locus from S288C or 59A. The average phenotype and standard deviation are indicated for each genotype group.

References

    1. Ansel J., Bottin H., Rodriguez-Beltran C., Damon C., Nagarajan M., et al. , 2008. Cell-to-cell stochastic variation in gene expression is a complex genetic trait. PLoS Genet. 4: e1000049. - PMC - PubMed
    1. Bely M., Sablayrolles J.-M., Barre P., 1990. Automatic detection of assimilable nitrogen deficiencies during alcoholic fermentation in oenological conditions. J. Ferment. Bioeng. 70: 246–252
    1. Ben-Ari G., Zenvirth D., Sherman A., David L., Klutstein M., et al. , 2006. Four linked genes participate in controlling sporulation efficiency in budding yeast. PLoS Genet. 2: e195. - PMC - PubMed
    1. Benjamini Y., Drai D., Elmer G., Kafkafi N., Golani I., 2001. Controlling the false discovery rate in behavior genetics research. Behav. Brain Res. 125: 279–284 - PubMed
    1. Bergmeyer H. U., Beutler H. O., 1990. Ammonia, pp. 454–461 in Methods of Enzymatic Analysis, 3rd Ed, Vol. III, edited by Bergmeyer H. U. VCH Publishers Ltd., Cambridge, UK