

Genome-wide Fitness Profiles Reveal a Requirement for Autophagy During Yeast Fermentation
- PMID: 22384346
- PMCID: PMC3276155
- DOI: 10.1534/g3.111.000836
Genome-wide Fitness Profiles Reveal a Requirement for Autophagy During Yeast Fermentation
Abstract
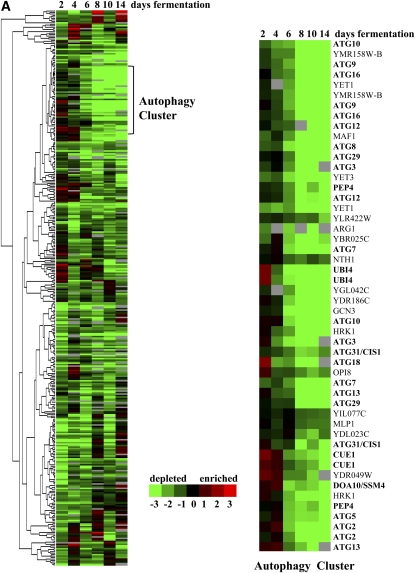
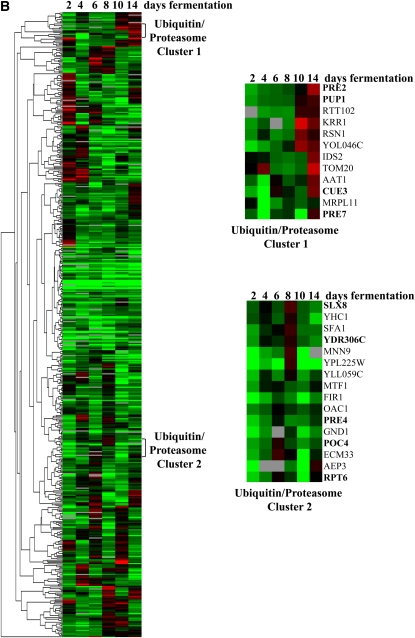
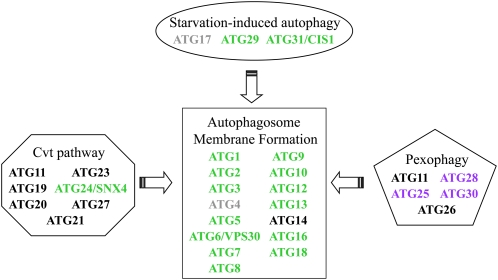
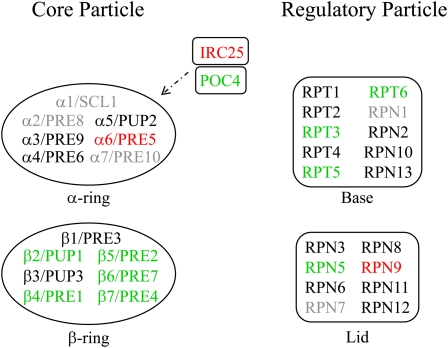
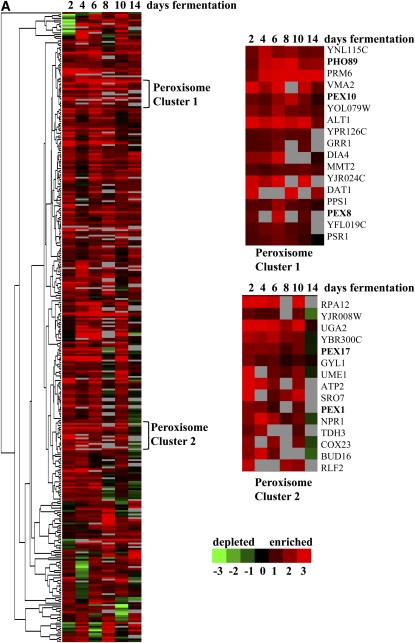
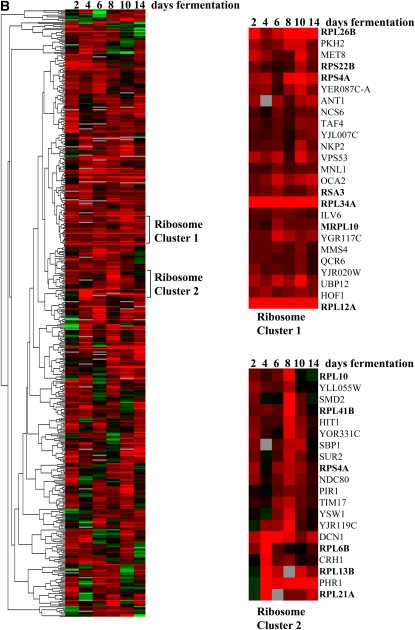
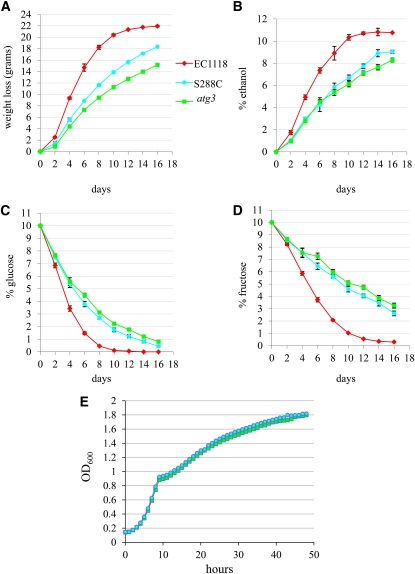
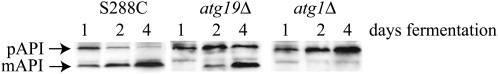
The ability of cells to respond to environmental changes and adapt their metabolism enables cell survival under stressful conditions. The budding yeast Saccharomyces cerevisiae (S. cerevisiae) is particularly well adapted to the harsh conditions of anaerobic wine fermentation. However, S. cerevisiae gene function has not been previously systematically interrogated under conditions of industrial fermentation. We performed a genome-wide study of essential and nonessential S. cerevisiae gene requirements during grape juice fermentation to identify deletion strains that are either depleted or enriched within the viable fermentative population. Genes that function in autophagy and ubiquitin-proteasome degradation are required for optimal survival during fermentation, whereas genes that function in ribosome assembly and peroxisome biogenesis impair fitness during fermentation. We also uncover fermentation phenotypes for 139 uncharacterized genes with no previously known cellular function. We demonstrate that autophagy is induced early in wine fermentation in a nitrogen-replete environment, suggesting that autophagy may be triggered by other forms of stress that arise during fermentation. These results provide insights into the complex fermentation process and suggest possible means for improvement of industrial fermentation strains.
Keywords: S. cerevisiae; autophagy; environmental stress; fermentation; fitness profiling.
Figures
Similar articles
-
Comparative transcriptomic analysis reveals similarities and dissimilarities in Saccharomyces cerevisiae wine strains response to nitrogen availability.PLoS One. 2015 Apr 17;10(4):e0122709. doi: 10.1371/journal.pone.0122709. eCollection 2015. PLoS One. 2015. PMID: 25884705 Free PMC article.
-
Genome-wide identification of genes involved in growth and fermentation activity at low temperature in Saccharomyces cerevisiae.Int J Food Microbiol. 2016 Nov 7;236:38-46. doi: 10.1016/j.ijfoodmicro.2016.07.010. Epub 2016 Jul 11. Int J Food Microbiol. 2016. PMID: 27442849
-
Genome-wide study of the adaptation of Saccharomyces cerevisiae to the early stages of wine fermentation.PLoS One. 2013 Sep 5;8(9):e74086. doi: 10.1371/journal.pone.0074086. eCollection 2013. PLoS One. 2013. PMID: 24040173 Free PMC article.
-
Responses of Saccharomyces cerevisiae to nitrogen starvation in wine alcoholic fermentation.Appl Microbiol Biotechnol. 2015 Sep;99(17):7025-34. doi: 10.1007/s00253-015-6810-z. Epub 2015 Jul 23. Appl Microbiol Biotechnol. 2015. PMID: 26201494 Review.
-
Biotechnological impact of stress response on wine yeast.Lett Appl Microbiol. 2017 Feb;64(2):103-110. doi: 10.1111/lam.12677. Epub 2016 Nov 21. Lett Appl Microbiol. 2017. PMID: 27714822 Review.
Cited by
-
Investigation of Bar-seq as a method to study population dynamics of Saccharomyces cerevisiae deletion library during bioreactor cultivation.Microb Cell Fact. 2020 Aug 18;19(1):167. doi: 10.1186/s12934-020-01423-z. Microb Cell Fact. 2020. PMID: 32811554 Free PMC article.
-
Recycling of iron via autophagy is critical for the transition from glycolytic to respiratory growth.J Biol Chem. 2017 May 19;292(20):8533-8543. doi: 10.1074/jbc.M116.762963. Epub 2017 Mar 20. J Biol Chem. 2017. PMID: 28320861 Free PMC article.
-
The multiple roles of lipid metabolism in yeast physiology during beer fermentation.Genet Mol Biol. 2022 Sep 16;45(3):e20210325. doi: 10.1590/1678-4685-GMB-2021-0325. eCollection 2022. Genet Mol Biol. 2022. PMID: 36149459 Free PMC article.
-
Comparative transcriptomic analysis reveals similarities and dissimilarities in Saccharomyces cerevisiae wine strains response to nitrogen availability.PLoS One. 2015 Apr 17;10(4):e0122709. doi: 10.1371/journal.pone.0122709. eCollection 2015. PLoS One. 2015. PMID: 25884705 Free PMC article.
-
Wine Yeast Cells Acquire Resistance to Severe Ethanol Stress and Suppress Insoluble Protein Accumulation during Alcoholic Fermentation.Microbiol Spectr. 2022 Oct 26;10(5):e0090122. doi: 10.1128/spectrum.00901-22. Epub 2022 Aug 30. Microbiol Spectr. 2022. PMID: 36040149 Free PMC article.
References
-
- Alper H., Moxley J., Nevoigt E., Fink G. R., Stephanopoulos G., 2006. Engineering yeast transcription machinery for improved ethanol tolerance and production. Science 314: 1565–1568 - PubMed
-
- Backhus L. E., DeRisi J., Bisson L. F., 2001. Functional genomic analysis of a commercial wine strain of Saccharomyces cerevisiae under differing nitrogen conditions. FEM. Yeast Res. 1: 111–125 - PubMed
LinkOut - more resources
Full Text Sources
Molecular Biology Databases