. 2012 Jan;2(1):123-30.
doi: 10.1534/g3.111.001248. Epub 2012 Jan 1.

Use of Cumulative Poisson Probability Distribution as an Estimator of the Recombination Rate in an Expanding Population: Example of the Macaca fascicularis Major Histocompatibility Complex

Use of Cumulative Poisson Probability Distribution as an Estimator of the Recombination Rate in an Expanding Population: Example of the Macaca fascicularis Major Histocompatibility Complex

Antoine Blancher et al. G3 (Bethesda). 2012 Jan.

Abstract

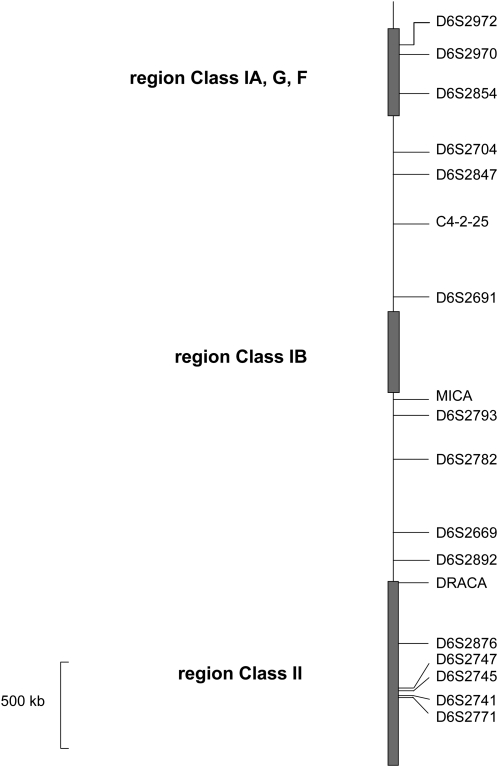
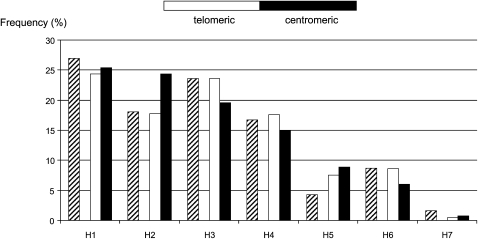
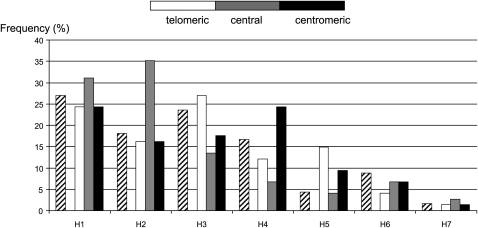
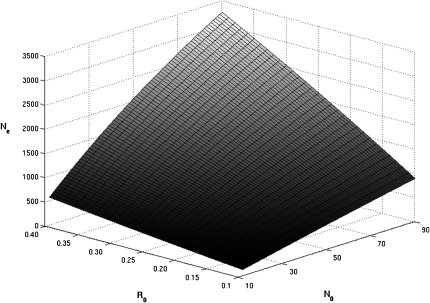
We describe a method to estimate the rate of recombination per generation from the genotypes of a large individual sample of an expanding population, for which the founding event is dated. The approach is illustrated with an application to estimating the major histocompatibility complex (MHC) recombination rate in the Mauritian macaque population. We genotyped 750 macaques by means of 17 microsatellites across the MHC region and reconstructed the seven most frequent haplotypes assumed to represent the founding haplotypes (H(rec(0))) as well as the 31% recombinant haplotypes (H(rec(h))) resulting from a variable number "h" of recombinations between the founding haplotypes. The relative frequencies of the various classes of haplotypes (H(rec(0)) and H(rec(h))) follow a Poisson distribution. By using a maximum likelihood method, we calculated the mean of the Poisson distribution that best fits the data. By dividing this mean by the number of generations (50-100) from the date of the population founding, we deduced that rate of recombination in the MHC is approximately 0.004 to 0.008 in the Mauritian macaque population. When the founding date of the population is precisely known, our method presents a useful alternative to the coalescent method.

Keywords: MHC; Macaca fascicularis; Poisson distribution; expanding population; major histocompatibility complex; recombination rate.


Figures

Figure 1
Figure 1
Localization of microsatellite markers on the MHC map of cynomolgus macaque. The regions of class-IA, -IB, and -II genes are shown as boxes (telomere is at the top of the diagram). The markers are positioned by reference to the sequence data (Watanabe et al. 2007; and T. Shiina, personal communication).
Figure 2
Figure 2
MHC haplotype frequencies in the Mauritian cynomolgus macaque population. (A) The frequencies of the seven most frequent haplotypes (founding haplotypes) and of the recombinant haplotypes in the 750 animals studied here. (B) The frequencies of intact and recombinant MHC haplotypes observed in our sample. The haplotypes are grouped in categories as a function of the number of recombinations they present: intact haplotypes (Hrec0) have no recombination, and recombinant haplotypes (Hrec(h)) can be deduced from founding haplotypes by assuming a variable number (h = 1−3) of recombinations
Figure 3
Figure 3
Haplotype frequency distribution observed at the two ends of haplotypes having a single recombination. The frequency distribution of founding haplotypes observed at the telomeric and centromeric ends of the 382 haplotypes having a single recombination is compared with the relative frequency distribution of the ancestral haplotypes in the sample (hatched bars, N = 1030). The frequency distribution at the telomeric end of recombinant haplotypes does not differ from the distribution of founding haplotypes (χ2 P = 0.56) whereas the frequency distribution at the centromeric end of recombinant haplotypes differed slightly (although significantly, χ2 P = 0.0003).
Figure 4
Figure 4
Haplotype frequencies observed in the three parts of haplotypes presenting two recombinations. The white, gray, and black bars represent, respectively, the frequencies of haplotypes in the “telomeric,” “central,” and “centromeric” regions of 74 recombinant haplotypes presenting two recombinations. The hatched bars correspond to the frequencies of the ancestral haplotypes (N = 1030). The frequency distributions of the telomeric and centromeric ends of double recombinant haplotypes are similar to those of intact MHC haplotypes (χ2 P = 0.56 and P = 0.39, respectively) whereas the frequency distribution in the “central” region differ significantly from the distribution of the founding haplotypes (χ2 P = 0.001).
Figure 5
Figure 5
Variation of Ne in function of R0 and N0 under classical logistic growth model of Verhulst. From the time of the macaque population founding up to nowadays (i.e. 50−100 generations), the average of Ne corresponds to the harmonic mean of the effective population size which was calculated under the assumption of a classical model of logistic growth (see Materials and Methods for more details). The figure shows the average Ne as a function of R0 (0.1−0.4) and N0 (10−90) with a constant maximum Ne population size (K = 12,000). With a mean generation time of 4 years, the average Ne varies from 125 to 3252, as shown in the figure. Under the hypothesis of a generation time of 8 years, the Ne varies from 63 to 1880 (figure not shown).

References

    1. Aarnink A., Dereuddre-Bosquet N., Vaslin B., Le Grand R., Winterton P., et al. , 2011. Influence of the MHC genotype on the progression of experimental SIV infection in the Mauritian cynomolgus macaque. Immunogenetics 63: 267–274 - PubMed
    1. Beck S., Trowsdale J., 2000. The human major histocompatibility complex: lessons from the DNA sequence. Annu. Rev. Genomics Hum. Genet. 1: 117–137 - PubMed
    1. Bonhomme M., Blancher A., Crouau-Roy B., 2005. Multiplexed microsatellites for rapid identification and characterization of individuals and populations of Cercopithecidae. Am. J. Primatol. 67: 385–391 - PubMed
    1. Bonhomme M., Blancher A., Cuartero S., Chikhi L., Crouau-Roy B., 2008. Origin and number of founders in an introduced insular primate: estimation from nuclear genetic data. Mol. Ecol. 17: 1009–1019 - PubMed
    1. Budde M. L., Wiseman R. W., Karl J. A., Hanczaruk B., Simen B. B., et al. , 2010. Characterization of Mauritian cynomolgus macaque major histocompatibility complex class I haplotypes by high-resolution pyrosequencing. Immunogenetics 62: 773–780 - PMC - PubMed

LinkOut - more resources