

Genetic analysis of hematological parameters in incipient lines of the collaborative cross
- PMID: 22384394
- PMCID: PMC3284323
- DOI: 10.1534/g3.111.001776
Genetic analysis of hematological parameters in incipient lines of the collaborative cross
Abstract
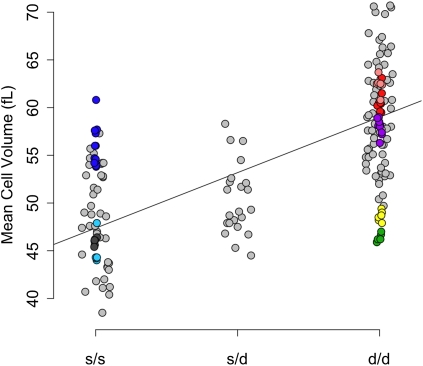
Hematological parameters, including red and white blood cell counts and hemoglobin concentration, are widely used clinical indicators of health and disease. These traits are tightly regulated in healthy individuals and are under genetic control. Mutations in key genes that affect hematological parameters have important phenotypic consequences, including multiple variants that affect susceptibility to malarial disease. However, most variation in hematological traits is continuous and is presumably influenced by multiple loci and variants with small phenotypic effects. We used a newly developed mouse resource population, the Collaborative Cross (CC), to identify genetic determinants of hematological parameters. We surveyed the eight founder strains of the CC and performed a mapping study using 131 incipient lines of the CC. Genome scans identified quantitative trait loci for several hematological parameters, including mean red cell volume (Chr 7 and Chr 14), white blood cell count (Chr 18), percent neutrophils/lymphocytes (Chr 11), and monocyte number (Chr 1). We used evolutionary principles and unique bioinformatics resources to reduce the size of candidate intervals and to view functional variation in the context of phylogeny. Many quantitative trait loci regions could be narrowed sufficiently to identify a small number of promising candidate genes. This approach not only expands our knowledge about hematological traits but also demonstrates the unique ability of the CC to elucidate the genetic architecture of complex traits.
Keywords: Mouse Collaborative Cross; Mouse Genetic Resource; QTL; complex traits; hematology; hemoglobin β; mean red cell volume; mouse genetics; shared ancestry.
Figures


References
-
- Arakawa R., Bagashev A., Song L., Maurer K., Sullivan K., 2010. Characterization of LRRFIP1. Biochem. Cell Biol. 88: 899–906 - PubMed
-
- Becker K., Tilley L., Vennerstrom J. L., Roberts D., Rogerson S., et al. , 2004. Oxidative stress in malaria parasite-infected erythrocytes: host-parasite interactions. Int. J. Parasitol. 34: 163–189 - PubMed
-
- Chen J., Harrison D. E., 2002. Quantitative trait loci regulating relative lymphocyte proportions in mouse peripheral blood. Blood 99: 561–566 - PubMed
-
- Cheung C., Martin I. C. A., Zenger K., Donald J., Thomson P., et al. , 2004. Quantitative trait loci for steady-state platelet count in mice. Mamm. Genome 15: 784–797 - PubMed
Grants and funding
LinkOut - more resources
Full Text Sources
Molecular Biology Databases