. 2012 Mar;7(3):335-52.
doi: 10.2217/nnm.11.104.

Chemotherapy targeting by DNA capture in viral protein particles

Affiliations

Chemotherapy targeting by DNA capture in viral protein particles

Hasmik Agadjanian et al. Nanomedicine (Lond). 2012 Mar.

Erratum in

  • Nanomedicine (Lond). 2012 Aug;7(8):1275-6

Abstract

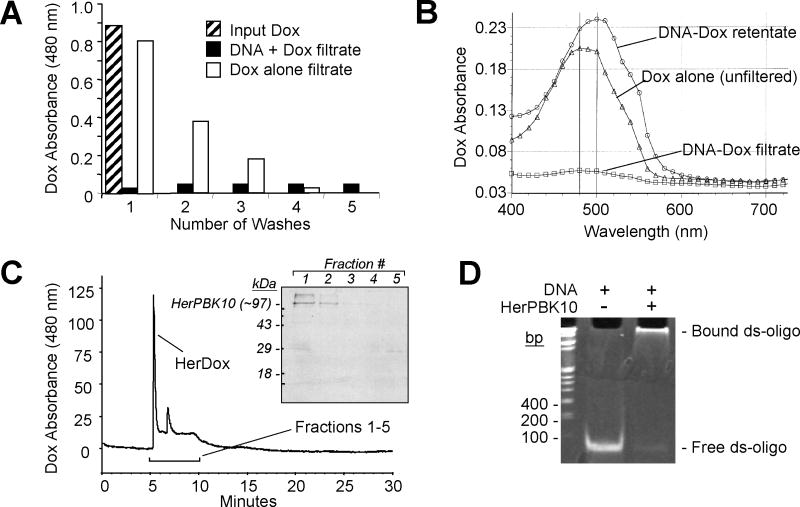
Aim: This study tests the hypothesis that DNA intercalation and electrophilic interactions can be exploited to noncovalently assemble doxorubicin in a viral protein nanoparticle designed to target and penetrate tumor cells through ligand-directed delivery. We further test whether this new paradigm of doxorubicin targeting shows therapeutic efficacy and safety in vitro and in vivo.

Materials & methods: We tested serum stability, tumor targeting and therapeutic efficacy in vitro and in vivo using biochemical, microscopy and cytotoxicity assays.

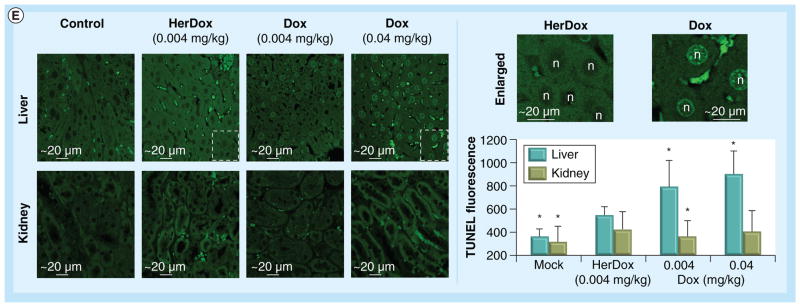
Results: Self-assembly formed approximately 10-nm diameter serum-stable nanoparticles that can target and ablate HER2+ tumors at >10× lower dose compared with untargeted doxorubicin, while sparing the heart after intravenous delivery. The targeted nanoparticle tested here allows doxorubicin potency to remain unaltered during assembly, transport and release into target cells,while avoiding peripheral tissue damage and enabling lower, and thus safer, drug dose for tumor killing.

Conclusion: This nanoparticle may be an improved alternative to chemical conjugates and signal-blocking antibodies for tumor-targeted treatment.


Figures

Figure 1
Figure 1. Her-doxorubicin assembly
(A) Assembly of DNA-Dox. A480 (Dox absorbance maximum) of DNA-Dox and free Dox filtrates during assembly. Input Dox, A480 before filtration. (B) Absorbance spectra of DNA-Dox retentate and filtrate after assembly. (C) HerPBK10 binding to DNA–Dox. HPLC graph shows eluates (detected based on Dox absorbance) collected over time from a size exclusion column. Inset, SDS-PAGE and immunoblotting of HPLC fractions collected at 6–10 min (fractions 1–5). Immunodetection of HerPBK10 was performed as described previously [10]. In subsequent experiments, HerDox was collected from the 6-min peak. (D) Electrophoretic mobility shift assay showing HerPBK10 binding to ds-oligo. Duplex (150 ng) was incubated with HerPBK10 (4 μg) for 10 min at room temperature before 15% polyacrylamide gel electrophoresis, followed by ethidium bromide stain (30 min) before UV visualization. Dox: Doxorubicin; ds-oligo: Double-stranded annealed complementary oligonucleotides.
Figure 2
Figure 2. Cryo-electron microscopy of Her-doxorubicin particles
Micrographs show the formation of small particles that are mostly round (delineated regions) or with less defined shape (left arrows), as well as larger aggregates (right arrow). Macro aggregates up to 200 nm and larger were also evident (not shown). Numbered areas highlighting representative round particles are enlarged in right panels. Sample preparation and imaging was performed by NanoImaging Services, Inc., CA, USA.
Figure 3
Figure 3. Stability in serum
(A) Stability in blood. Retentate and filtrate fluorescences of HerDox or Dox after 1 h incubation in mouse blood, saline or 0.5 mM EDTA at 37°C, followed by ultrafiltration (n = 3). (B) Representative gels (n = 4 per experiment) showing DNA protection in serum. The double-stranded oligonucleotide-oligo prebound by Dox (+Dox), HerPBK10 (+HerPBK10), or both was incubated for 20 min in 100% mouse serum (Abcam, MA, USA) before polyacrylamide gel electrophoresis and ethidium bromide staining to visualize the DNA (Dox fluorescence was not visible on the gel at the concentrations used). Control conditions preventing digest include using HI serum and 0°C incubation. (C) Assessing Dox retention in serum. Fluorescence spectra of Dox, DNA-Dox and HerDox before (input) and after incubation in 100% mouse serum followed by ultrafiltration and measurement of retentates. Dox: Doxorubicin; EDTA: Ethylenediaminetetraacetic acid; HI: Heat-inactivated.
Figure 4
Figure 4. Targeted toxicity in vitro
All treatments, n = 3. (A) Comparing cytotoxicity with HER2+ (MDA-MB-435) and HER2− (MDA-MB-231) cells in separate cultures. Relative survival (as a percentage of untreated cells) on day 3 of treatment. (B) Micrograph of live cells after treatment. Control, mock (4-(2-hydroxyethyl)-1-piperazineethanesulfonic acid buffered saline) treatment. (C) Receptor specificity of cytotoxicity. Relative survival of MDA-MB-435 cells receiving HerDox −/+ competing ligand (eHRG). (D) Toxicity to cells displaying differential HER2. Cytotoxicities from HerDox titrations were assessed on each cell line by metabolic assay and confirmed by crystal violet stain on day 3 of treatment. CD50 values (shown in log scale) were determined by nonlinear regression analyses of HerDox killing curves using GraphPad Prism. The relative HER2 level of each cell line (obtained in Supplementary Figure 2) is shown next to each CD50 value. (E) Targeting in a mixed MDA-MB-435 (HER2+,GFP-)/MDA-MB-231(HER2−,GFP+) cell culture. Survival was determined by calculating the relative doubling time of experimental cells normalized by mock-treated cells based on crystal violet stains (total cells) and GFP fluorescence (MDA-MB-231 cells), and applying DTMDA-MB-435 = DTTotal − DTMDA-MB-231 as described previously [11]. Relative survival is shown for day 2 of treatment. (F) Targeted glioma cell death in vitro. U251 cells were treated once with the indicated HerDox (and competitive inhibitor where indicated) or Dox doses and measured for cell survival at the indicated time points after treatment. *p < 0.05 compared with mock. DT: Doubling time; Dox: Doxorubicin; Un: Untreated.
Figure 5
Figure 5. Intracellular doxorubicin release
HerDox and Dox (0.5 μM final Dox concentration) uptake and trafficking, assessed in (A & B) fixed and (C) live MDA-MB-435 cells. (A) Uptake pattern of Dox fluorescence (red) when administered as free Dox or HerDox. (B) HerPBK10 (green) and Dox (red) destinations after HerDox uptake. (C) Live MDA-MB-435 cells after incubation with HerDox or Dox for 1 h, followed by washing. Dox fluorescence (magenta) is overlaid on differential interference contrast images. (D) Double-stranded oligo stability in cytosolic lysates. Gels show ethidium bromide-staining of duplex and 3-kb plasmid after incubation with either lysate or 4-(2-hydroxyethyl)-1-piperazineethanesulfonic acid-buffered saline (-lysate). Relaxed (nicked) and supercoiled plasmid forms are indicated. Dox: Doxorubicin; ds-oligo: Double-stranded annealed complementary oligonucleotides; SC: Supercoiled DNA.
Figure 6
Figure 6. Preferential targeting to HER2+ tumors
Tumor-bearing mice were intravenously injected with HerDox or Dox and (A) imaged with a custom small animal imager adjusted to detect Dox fluorescence (see Materials & methods), or (B–D) euthanized, and tissues harvested at indicated time points for biodistribution and pharmacokinetic analyses. (A) Live mouse imaging of HerDox at indicated time points after injection. Tumors are indicated by the arrows. (B–C) Comparative biodistribution of HerDox and Dox in tissues harvested at 3 h postinjection. (B) Imaging of biodistribution in harvested tissues. Pseudocolored fluorescence intensity (FI) corresponds to the color bar. The maximum represents the highest FI. (C) Quantification of HerDox and Dox biodistribution, showing Dox FI/tissue. Dox: Doxorubicin. Tumor-bearing mice were intravenously injected with HerDox or Dox and (A) imaged with a custom small animal imager adjusted to detect Dox fluorescence (see Materials & methods), or (B–D) euthanized, and tissues harvested at indicated time points for biodistribution and pharmacokinetic analyses. (D) Comparative pharmacokinetics of HerDox and Dox in mice with tumors expressing differential HER2. Tissues were harvested from independently injected mice euthanized at indicated time points after injection and fluorescence intensity/tissue acquired using a small animal imaging system as described (see Materials & methods). Dox: Doxorubicin.
Figure 7
Figure 7. HerDox induces tumor-targeted growth ablation while sparing the heart after intravenous delivery
Comparison of HerDox (0.004 mg/kg) and Dox (0.004 or 0.04 mg/kg, where indicated) on (A) tumor growth (n = 8–10 tumors per treatment); (B) animal weight (n = 4–5 mice/treatment group); (C) cardiac tissue; (D) cardiac function (n = 3 mice/treatment group); and (E) liver and kidney tissue. Day 0 in (A & B) corresponds to 3 days before tail vein injections. Control (saline-injected) mice were euthanized early due to tumor ulceration, in compliance with Institutional Animal Care and Use Committee policy. Tumor growth in (A) was obtained by measuring tumor volumes (see Materials & methods). (C) Histology of myocardia from treated mice. Micrographs show representative hematoxylin and eosin-stained specimens from treated mice (40× magnification). (D) Echocardiography of mice obtained at 25 days following injections. *p < 0.05, compared with mock treatment (intravenous delivery of saline at equivalent volume to HerDox). (B–D) Results were obtained from mice receiving 0.004 mg/kg doses of Dox or HerDox. HerPBK10 dose equates HerDox protein concentration. CO: Cardiac output; d: Diastolic; Dox: Doxorubicin; LV vol: Left ventricular volume; LVID: Left ventricular internal dimension; s: Systolic; SV: Stroke volume. Comparison of HerDox (0.004 mg/kg) and Dox (0.004 or 0.04 mg/kg, where indicated) on (E) liver and kidney tissue. (E) TUNEL staining and quantification in liver and kidney tissue obtained from treated mice. Micrographs obtained at 20× magnification (left set of panels) show fluorescently stained nuclei in apoptotic cells (delineated areas are enlarged in micrographs to the right). Graph summarizes relative fluorescence intensities of each treated tissue (n > 200 fields per treatment). The quantification procedure is described in the Materials & methods section. *p < 0.0001 compared with each corresponding HerDox treatment. Dox: Doxorubicin.

Similar articles

Cited by

References

    1. Curigliano G, Mayer EL, Burstein HJ, Winer EP, Goldhirsch A. Cardiac toxicity from systemic cancer therapy: a comprehensive review. Prog Cardiovasc Dis. 2010;53(2):94–104. - PubMed
    1. Hurley LH. DNA and its associated processes as targets for cancer therapy. Nat Rev Cancer. 2002;2:188–200. - PubMed
    1. Lukyanov AN, Elbayoumi TA, Chakilam AR, Torchilin VP. Tumor-targeted liposomes: doxorubicin-loaded long-circulating liposomes modified with anti-cancer antibody. J Control Release. 2004;100(1):135–144. - PubMed
    1. Yoo HS, Park TG. Folate-receptor-targeted delivery of doxorubicin nano-aggregates stabilized by doxorubicin-PEG-folate conjugate. J Control Release. 2004;100(2):247–256. - PubMed
    1. Glockshuber R, Malia M, Pfitzinger I, Pluckthun A. A comparison of strategies to stabilize immunoglobulin Fv-fragments. Biochemistry. 1990;29(6):1362–1367. - PubMed

Website

    1. Demonstration of daily tail vein injections. www.youtube.com/watch?v=zbqjZ2HL_-0.

Publication types

MeSH terms