. 2012 Mar 2:7:22.
doi: 10.1186/1746-1596-7-22.

Identification of tumor epithelium and stroma in tissue microarrays using texture analysis

Affiliations

Identification of tumor epithelium and stroma in tissue microarrays using texture analysis

Nina Linder et al. Diagn Pathol. .

Abstract

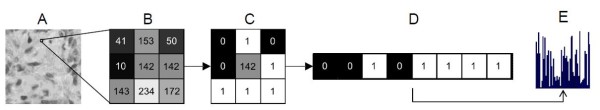
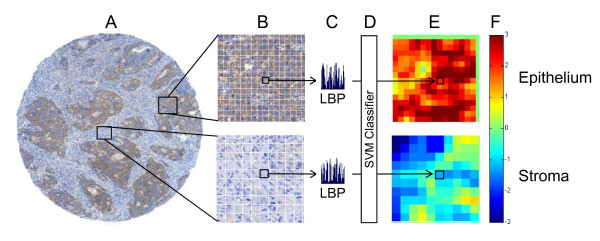
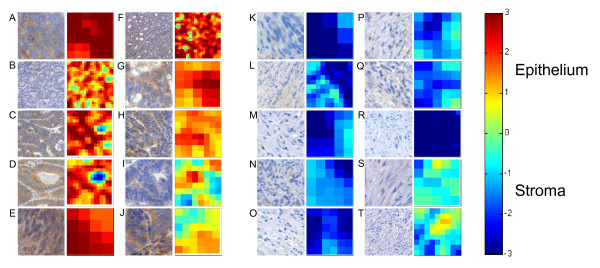
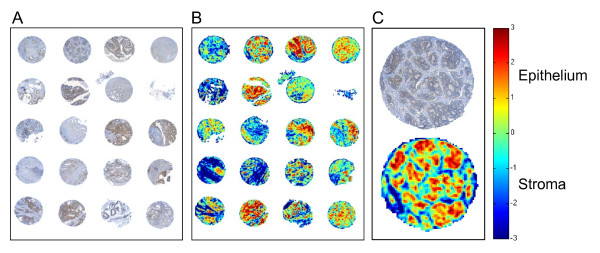
Background: The aim of the study was to assess whether texture analysis is feasible for automated identification of epithelium and stroma in digitized tumor tissue microarrays (TMAs). Texture analysis based on local binary patterns (LBP) has previously been used successfully in applications such as face recognition and industrial machine vision. TMAs with tissue samples from 643 patients with colorectal cancer were digitized using a whole slide scanner and areas representing epithelium and stroma were annotated in the images. Well-defined images of epithelium (n = 41) and stroma (n = 39) were used for training a support vector machine (SVM) classifier with LBP texture features and a contrast measure C (LBP/C) as input. We optimized the classifier on a validation set (n = 576) and then assessed its performance on an independent test set of images (n = 720). Finally, the performance of the LBP/C classifier was evaluated against classifiers based on Haralick texture features and Gabor filtered images.

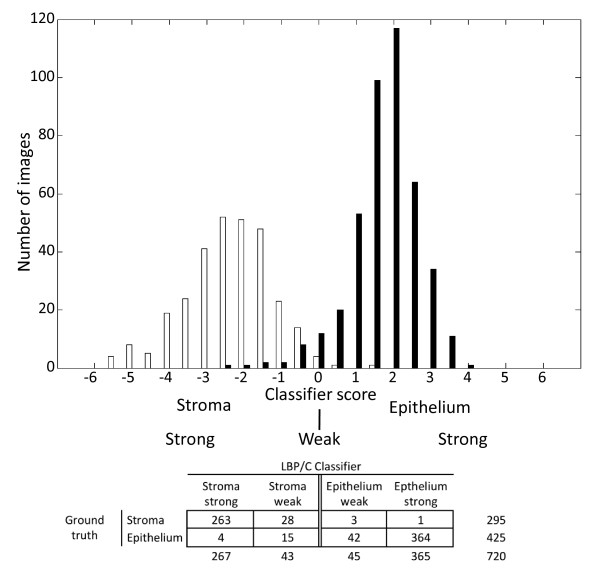
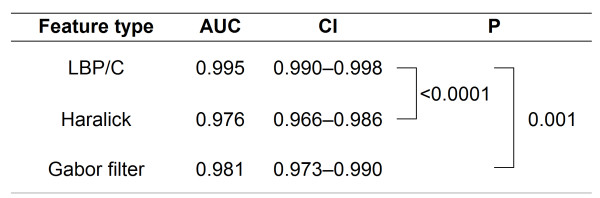
Results: The proposed approach using LPB/C texture features was able to correctly differentiate epithelium from stroma according to texture: the agreement between the classifier and the human observer was 97 per cent (kappa value = 0.934, P < 0.0001) and the accuracy (area under the ROC curve) of the LBP/C classifier was 0.995 (CI95% 0.991-0.998). The accuracy of the corresponding classifiers based on Haralick features and Gabor-filter images were 0.976 and 0.981 respectively.

Conclusions: The method illustrates the capability of automated segmentation of epithelial and stromal tissue in TMAs based on texture features and an SVM classifier. Applications include tissue specific assessment of gene and protein expression, as well as computerized analysis of the tumor microenvironment.

Virtual slides: The virtual slide(s) for this article can be found here: http://www.diagnosticpathology.diagnomx.eu/vs/4123422336534537.


Figures

Figure 1
Figure 1
Local binary patterns (LBP) are defined for an image (A) based on its grayscale values. For every 3 × 3 pixel neighborhood (B) within the image, an LBP code is generated by thresholding the surrounding pixels using the value of the central pixel (C-D). A histogram (E) of the all LBP codes within the analyzed image is formed to represent texture properties of the image
Figure 2
Figure 2
Principle of image annotation, block-based feature extraction and classification. Areas representative of pure tumor epithelium and stroma were identified in the digitized tissue microarray spots (A) and then split into blocks of size 80 × 80 pixels (B). A local binary pattern (LBP/C) operator was applied to the blocks and block-specific LBP histograms generated (C). The block histograms are then used as input to a support vector machine (SVM) classifier (D), which assigns a tissue category (epithelium or stroma) score to the block. The SVM score for each block is pseudo colored to visualize the output (E), and the average block score is taken to represent the predicted class of an image (F)
Figure 3
Figure 3
Performance results for LBP/C, Haralick and Gabor texture descriptors on the validation set (colorectal cancer images; n = 576). A linear classifier was optimized for each of the descriptors by computing the accuracy, AUC (area under the ROC curve) over a set of C values (Cost parameter) growing in exponential sequence C = 20,..., 220. The AUC was computed on block level. The selected C values based on the validation tests were: LBP/C; C = 300, Haralick features; C = 2048, and Gabor filters; C = 2
Figure 4
Figure 4
Contingency table for discrimination of colorectal cancer stroma and epithelium images in the test set (colorectal cancer images; n = 720) using the local binary pattern (LBP/C) classifier. The value of the score generated by the classifier defines to which class the test image is assigned, i.e. strong or weak epithelium (black bars) or stroma (white bars)
Figure 5
Figure 5
Summary of feature types and accuracy (area under the ROC curve) for each feature type in the test set (colorectal cancer images; n = 720) respectively. CI = confidence interval.
Figure 6
Figure 6
Example images of epithelial and stromal tissue in the test set (colorectal cancer images; n = 720). A-H represents examples of histological images that have been strongly- and I-J images that have been weakly classified as epithelium by the local binary pattern classifier. K-R represents examples of tissues that have been strongly assigned into stroma, and S-T images that have been weakly classified as stroma
Figure 7
Figure 7
A part of a digitized colorectal cancer tissue microarray (TMA) immunostained with epidermal growth factor receptor (EGFR) antibody (A) and the same TMA as processed by the local binary pattern (LBP/C) classifier (B). One representative tissue spot and its corresponding LBP/C result image. The bar on the right shows the heat map for the LBP/C classifier score values

References

    1. Hassan S, Ferrario C, Mamo A, Basik M. Tissue microarrays: emerging standard for biomarker validation. Curr Opin Biotechnol. 2008;19(1):19–25. doi: 10.1016/j.copbio.2007.10.009. - DOI - PubMed
    1. Torhorst J, Bucher C, Kononen J, Haas P, Zuber M, Kochli OR, Mross F, Dieterich H, Moch H, Mihatsch M. et al.Tissue microarrays for rapid linking of molecular changes to clinical endpoints. Am J Pathol. 2001;159(6):2249–2256. doi: 10.1016/S0002-9440(10)63075-1. - DOI - PMC - PubMed
    1. Rexhepaj E, Brennan DJ, Holloway P, Kay EW, McCann AH, Landberg G, Duffy MJ, Jirstrom K, Gallagher WM. Novel image analysis approach for quantifying expression of nuclear proteins assessed by immunohistochemistry: application to measurement of oestrogen and progesterone receptor levels in breast cancer. Breast Cancer Res. 2008;10(5):R89. doi: 10.1186/bcr2187. - DOI - PMC - PubMed
    1. Dahlman A, Rexhepaj E, Brennan DJ, Gallagher WM, Gaber A, Lindgren A, Jirstrom K, Bjartell A. Evaluation of the prognostic significance of MSMB and CRISP3 in prostate cancer using automated image analysis. Mod Pathol. 2011;24(5):708–719. doi: 10.1038/modpathol.2010.238. - DOI - PubMed
    1. Konsti J, Lundin M, Joensuu H, Lehtimaki T, Sihto H, Holli K, Turpeenniemi-Hujanen T, Kataja V, Sailas L, Isola J. et al.Development and evaluation of a virtual microscopy application for automated assessment of Ki-67 expression in breast cancer. BMC Clin Pathol. 2011;11:3. doi: 10.1186/1472-6890-11-3. - DOI - PMC - PubMed

Publication types