. 2012 Mar 2;3(2):9.
doi: 10.1186/scrt100.

Hypoxia mediated isolation and expansion enhances the chondrogenic capacity of bone marrow mesenchymal stromal cells

Affiliations

Hypoxia mediated isolation and expansion enhances the chondrogenic capacity of bone marrow mesenchymal stromal cells

Adetola B Adesida et al. Stem Cell Res Ther. .

Abstract

Introduction: The capacity of bone marrow mesenchymal stromal cells (BMSCs) to be induced into chondrocytes has drawn much attention for cell-based cartilage repair. BMSCs represent a small proportion of cells of the bone marrow stromal compartment and, thus, culture expansion is a necessity for therapeutic use. However, there is no consensus on how BMSCs should be isolated nor expanded to maximize their chondrogenic potential. During embryonic development pluripotent stem cells differentiate into chondrocytes and form cartilage in a hypoxic microenvironment.

Methods: Freshly harvested human BMSCs were isolated and expanded from the aspirates of six donors, under either hypoxic conditions (3% O2) or normoxic conditions (21% O2). A colony-forming unit fibroblastic (Cfu-f) assay was used to determine the number of cell colonies developed from each donor. BMSCs at passage 2 (P2) were characterized by flow cytometry for the phenotypic expression of cell surface markers on mesenchymal stem cells. BMSCs at P2 were subsequently cultured in vitro as three-dimensional cell pellets in a defined serum-free chondrogenic medium under normoxic and hypoxic conditions. Chondrogenic differentiation of the BMSCs was characterized by biochemical and histological methods and by quantitative gene-expression analysis.

Results: After 14 days of culture, the number of BMSC colonies developed under hypoxia was generally higher (8% to 38% depending on donor) than under normoxia. BMSCs were positive for the cell surface markers CD13, CD29, CD44, CD73, CD90, CD105 and CD151, and negative for CD34. Regardless of the oxygen tension during pellet culture, hypoxia-expanded BMSC pellets underwent a more robust chondrogenesis than normoxia-expanded BMSC pellets after three weeks of culture, as judged by increased glycosaminoglycan synthesis and Safranin O staining, along with increased mRNA expression of aggrecan, collagen II and Sox9. Hypoxic conditions enhanced the mRNA expression of hypoxia inducible factor-2 alpha (HIF-2α) but suppressed the mRNA expression of collagen X in BMSC pellet cultures regardless of the oxygen tension during BMSC isolation and propagation.

Conclusions: Taken together, our data demonstrate that isolation and expansion of BMSCs under hypoxic conditions augments the chondrogenic potential of BMSCs. This suggests that hypoxia-mediated isolation and expansion of BMSCs may improve clinical applications of BMSCs for cartilage repair.


Figures

Figure 1
Figure 1
Experimental set up for isolation, expansion and in vitro chondrogenesis of bone marrow mesenchymal stromal cells (BMSCs).
Figure 2
Figure 2
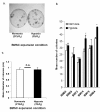
(A) Representative photograph of colony forming unit fibroblastic (cfu-f) assay of passage 0 (P0) BMSC after 14 days of culture under normoxia or hypoxia. Bone marrow mono-nucleated cells (MNCs) were seeded into 100 mm petri dish in triplicate (n = 3) at 250,000 MNCs per dish. Culture media was α-MEM comprising 10% FBS and 5 ng/ml FGF-2. Media were not changed within the first seven days. Thereafter, the media were changed twice a week. Developed cell colonies were visualized by crystal violet staining. (B) The number of cell colonies developed in the Cfu-f assay as described in A. The data represent mean ± standard error of colony counts derived from six donors (n = 3). (C) The mean diameter of cell colonies developed in the Cfu-f assay as described in A. The data represents mean ± standard error of colony counts derived from six donor specimens. Not significant (n.s.) = P > 0.05 or * P < 0.05 in normoxia versus hypoxia, Student's t test. BMSCs, bone marrow mesenchymal stromal cells; FBS, fetal bovine serum; FGF-2, fibroblast growth factor-2; MEM, modified Eagle's medium.
Figure 3
Figure 3
Flow cytometry analysis of cell surface markers on passaged 2 (P2) BMSCs after culture in α-MEM comprising 10% FBS and 5 ng/ml FGF-2. (A) Representative fluorescence intensity histograms are presented showing expression of cell surface markers of normoxia- and hypoxia-expanded BMSCs at P2 of a 43-year-old man (BM74). (B-D) The mean fluorescence intensity (MFI) of cell surface markers on BMSCs from: (B) a 34-year old woman (BM68), (C) a 43-year-old man (BM74), (D) a 62-year-old man (BM84). (E) Represents the mean fluorescence intensity ± standard error of three donors; BM68, BM74 and BM84. *P < 0.05 in normoxia versus hypoxia, Student's t test. BMSCs, bone marrow mesenchymal stromal cells; FBS, fetal bovine serum; FGF-2, fibroblast growth factor-2; MEM, modified Eagle's medium.
Figure 4
Figure 4
Paraffin wax 5 μm-section pellets were stained with safranin-O/fast green stain. All photomicrographs represent low (4x objectives) images. (A-D) 34-year-old woman (BM68), (F-I) 51-year-old man (BM73), (K-N) 43-year-old man (BM74) and (P-S) 62-year-old man (BM84). Scale bar is 100 μm. Biochemical assay of pellets for sulfated glycosaminoglycan (GAG) per DNA content. Pellets were cultured for three weeks in a defined serum-free chondrogenic medium under low (3%) or normal (21% O2) oxygen tension. Data are mean ± standard error of triplicates. (E) 34-year old woman (BM68), (J) 51-year-old man (BM73), (O) 43-year-old man (BM74) and (T) 62-year-old man (BM84). Data represent mean ± standard error of triplicate pellets; one-way ANOVA with Tukey's post hoc test: n.s. (not significant), * = P < 0.05, ** = P < 0.001 and *** = P < 0.0001. ANOVA, analysis of variance.
Figure 5
Figure 5
(A) Real-time PCR analysis of cDNA derived from pellet cultures of normoxia- and hypoxia-expanded BMSCs. Pellet cultures were performed under normoxic or hypoxic conditions for three weeks in the presence of defined serum-free chondrogenic factors as described Materials and Methods text. Real-time PCR analysis was via SYBR Green detection. Presented data represent the mean ± standard error of pellets pooled from four donors (that is, BM68, BM73, BM74 and BM84) in triplicate (N = 4, n = 12 per experimental group). Data represent mean ± standard error of triplicate pellets per donor; one-way ANOVA with Tukey's post hoc test: n.s. (not significant), * = P < 0.05, ** = P < 0.001 and *** = P < 0.0001. Gene expression is presented as relative mRNA level normalized to mRNA expression of human β-actin; y-axis. ANOVA, analysis of variance; BMSCs, bone marrow mesenchymal stromal cells; PCR, polymerase chain reaction.
Figure 6
Figure 6
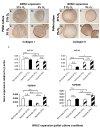
(A-H) Immuno-labeling of 5 μm-sections of pellets with anti-collagen types I and II. All photomicrographs represent low (4x objectives) images. Pellets were cultured for three weeks in chondrogenic medium under low (3%) or normal (21% O2) oxygen tension. Images were taken from pellets derived from BM73. Scale bar is 100 μm. (I) Real-time PCR analysis of cDNA derived from pellet cultures of normoxia- and hypoxia-expanded BMSCs. Pellet cultures were performed under normoxic or hypoxic conditions for three weeks in the presence of defined serum-free chondrogenic factors as described in the Materials and Methods text. Real-time PCR analysis was via SYBR Green detection. Presented data represent the mean ± standard error of pellets pooled from four donors (that is, BM68, BM73, BM74 and BM84) in triplicate (N = 4, n = 12 per experimental group). Data represent mean ± standard error of triplicate pellets; one-way ANOVA with Tukey's post hoc test: n.s. (not significant), * = P < 0.05 and *** = P < 0.0001. Gene expression is presented as relative mRNA level normalized to mRNA expression of human β-actin; y-axis. ANOVA, analysis of variance; BMSCs, bone marrow mesenchymal stromal cells; PCR, polymerase chain reaction.

References

    1. Brittberg M, Lindahl A, Nilsson A, Ohlsson C, Isaksson O, Peterson L. Treatment of deep cartilage defects in the knee with autologous chondrocyte transplantation. N Engl J Med. 1994;331:889–895. doi: 10.1056/NEJM199410063311401. - DOI - PubMed
    1. Lee CR, Grodzinsky AJ, Hsu HP, Martin SD, Spector M. Effects of harvest and selected cartilage repair procedures on the physical and biochemical properties of articular cartilage in the canine knee. J Orthop Res. 2000;18:790–799. doi: 10.1002/jor.1100180517. - DOI - PubMed
    1. von der Mark K, Gauss V, von der Mark H, Muller P. Relationship between cell shape and type of collagen synthesized as chondrocytes lose their cartilage phenotype in culture. Nature. 1977;267:531–532. doi: 10.1038/267531a0. - DOI - PubMed
    1. Watt FM. Effect of seeding density on stability of the differentiated phenotype of pig articular chondrocytes in culture. J Cell Sci. 1988;89:373–378. - PubMed
    1. Pittenger MF, Mackay AM, Beck SC, Jaiswal RK, Douglas R, Mosca JD, Moorman MA, Simonetti DW, Craig S, Marshak DR. Multilineage potential of adult human mesenchymal stem cells. Science. 1999;284:143–147. doi: 10.1126/science.284.5411.143. - DOI - PubMed

Publication types