. 2012 Mar 2;10(3):259-72.
doi: 10.1016/j.stem.2012.02.003.

Endogenous bone marrow MSCs are dynamic, fate-restricted participants in bone maintenance and regeneration

Affiliations

Endogenous bone marrow MSCs are dynamic, fate-restricted participants in bone maintenance and regeneration

Dongsu Park et al. Cell Stem Cell. .

Abstract

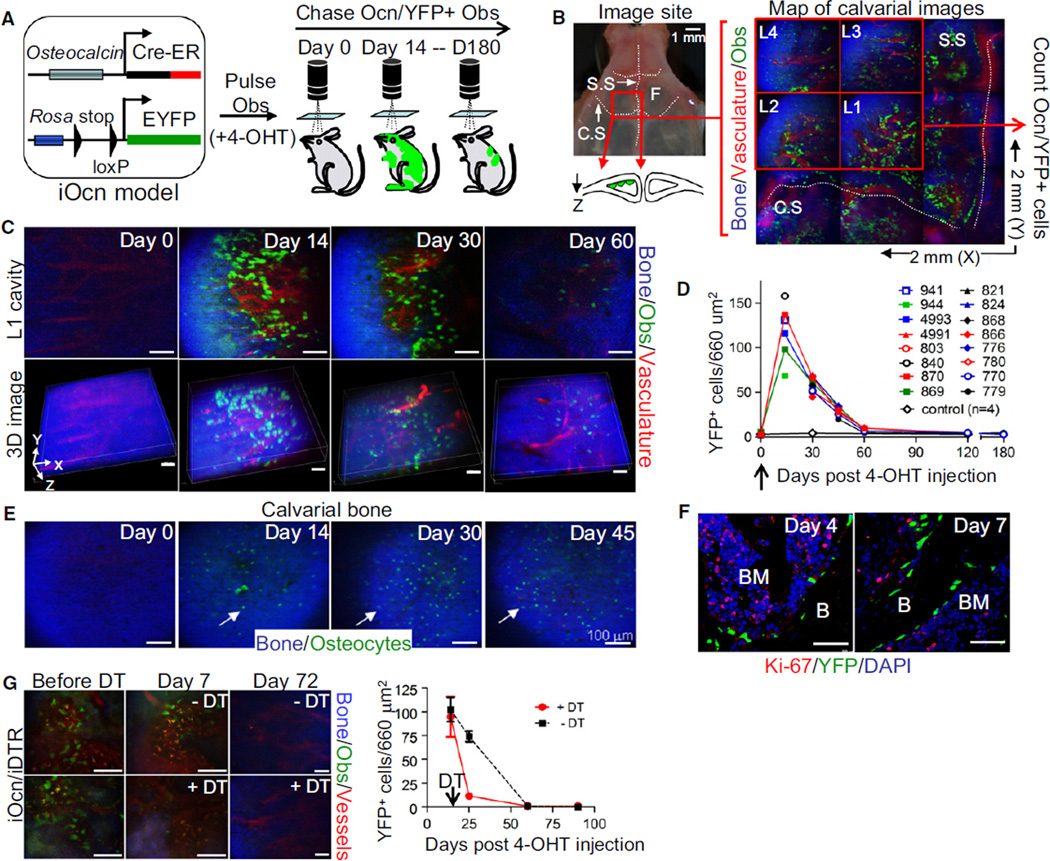
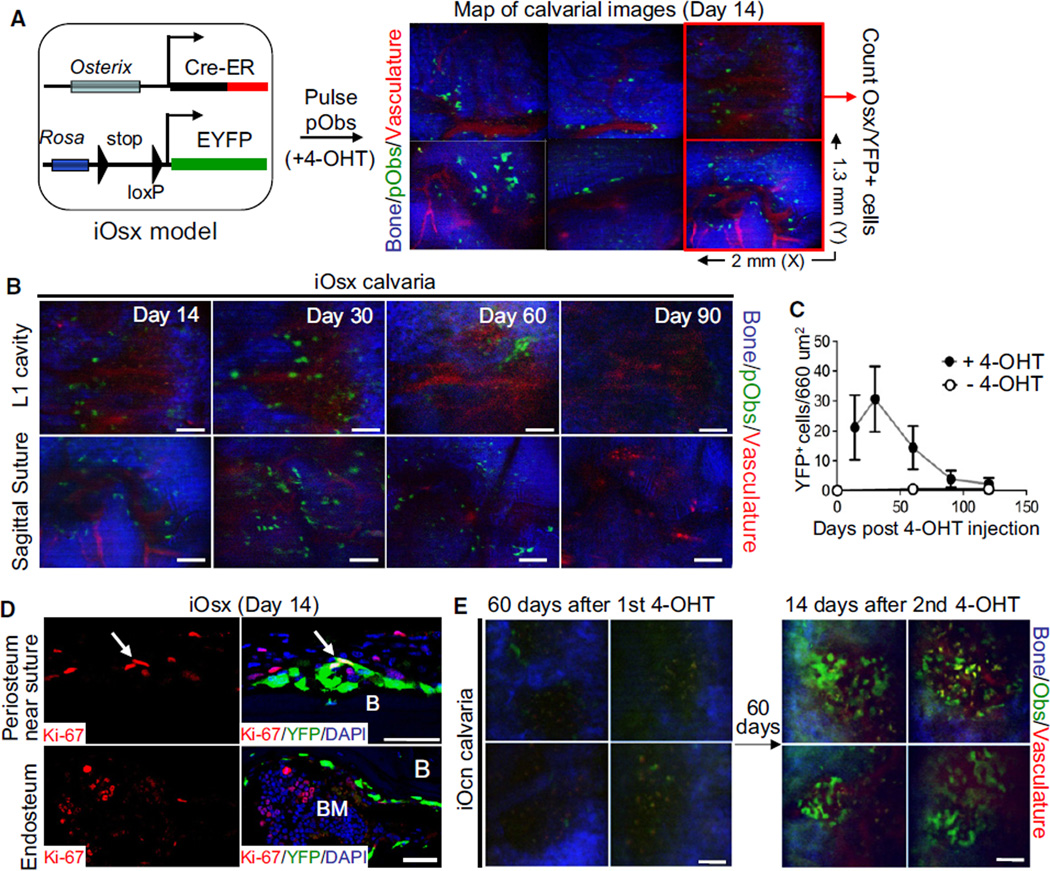
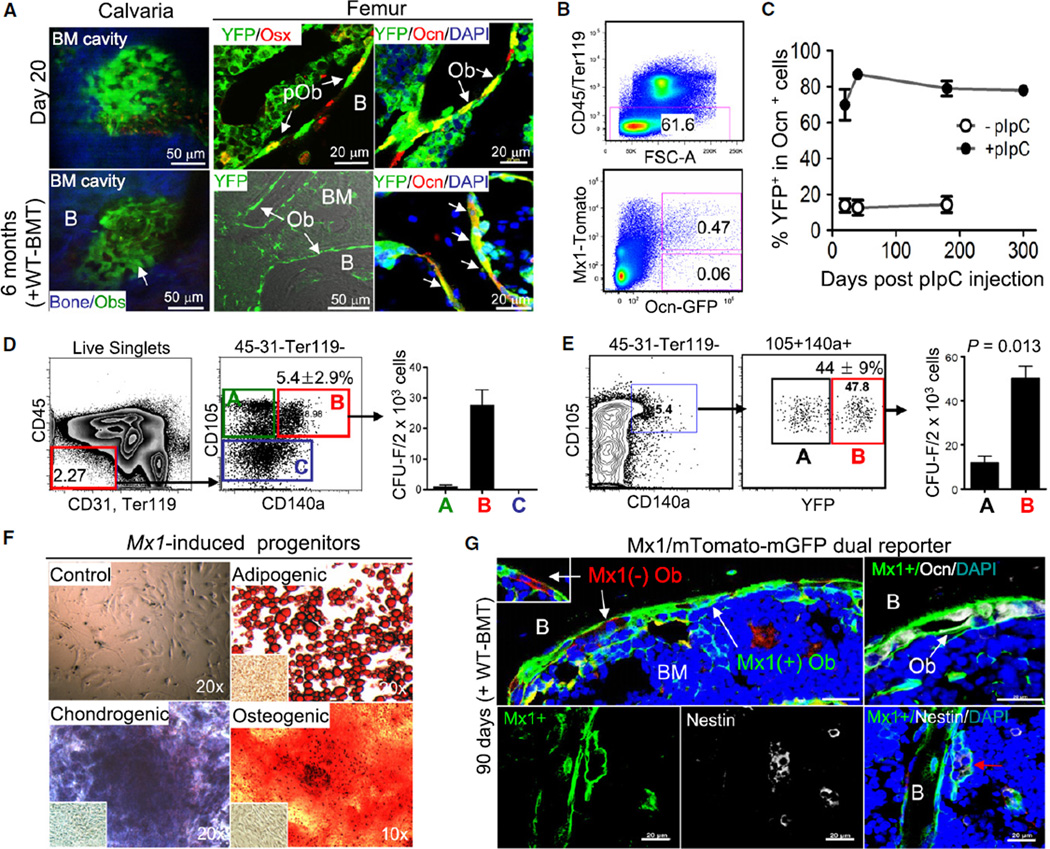
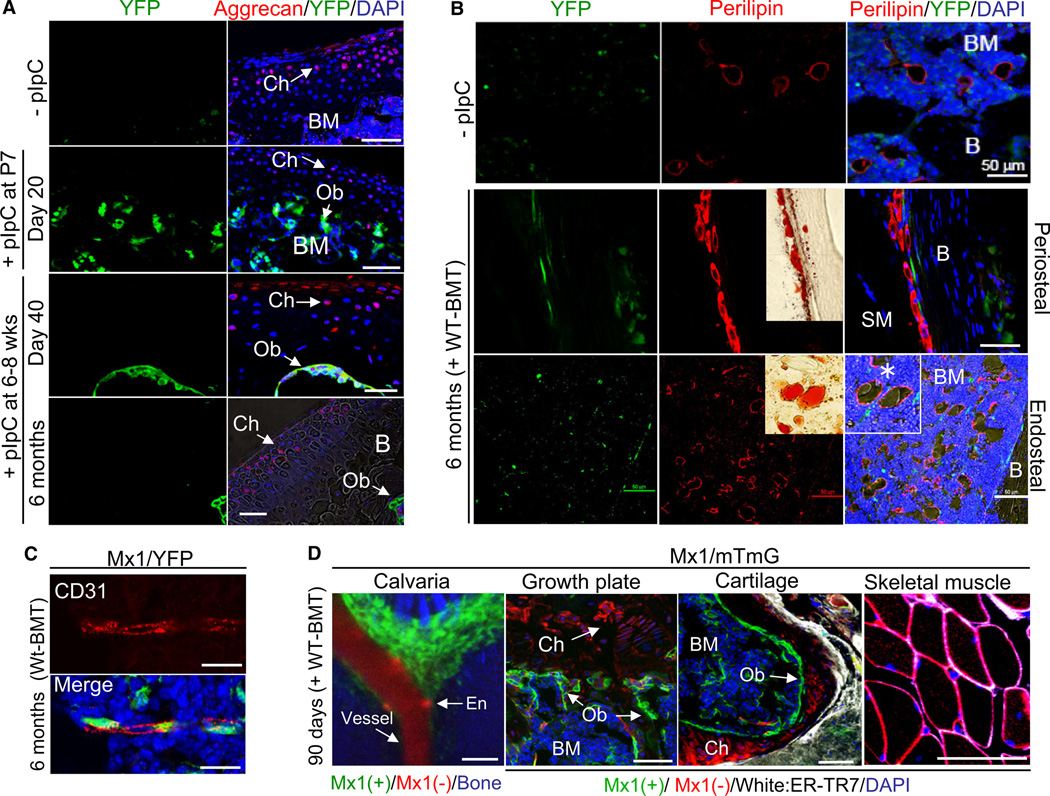
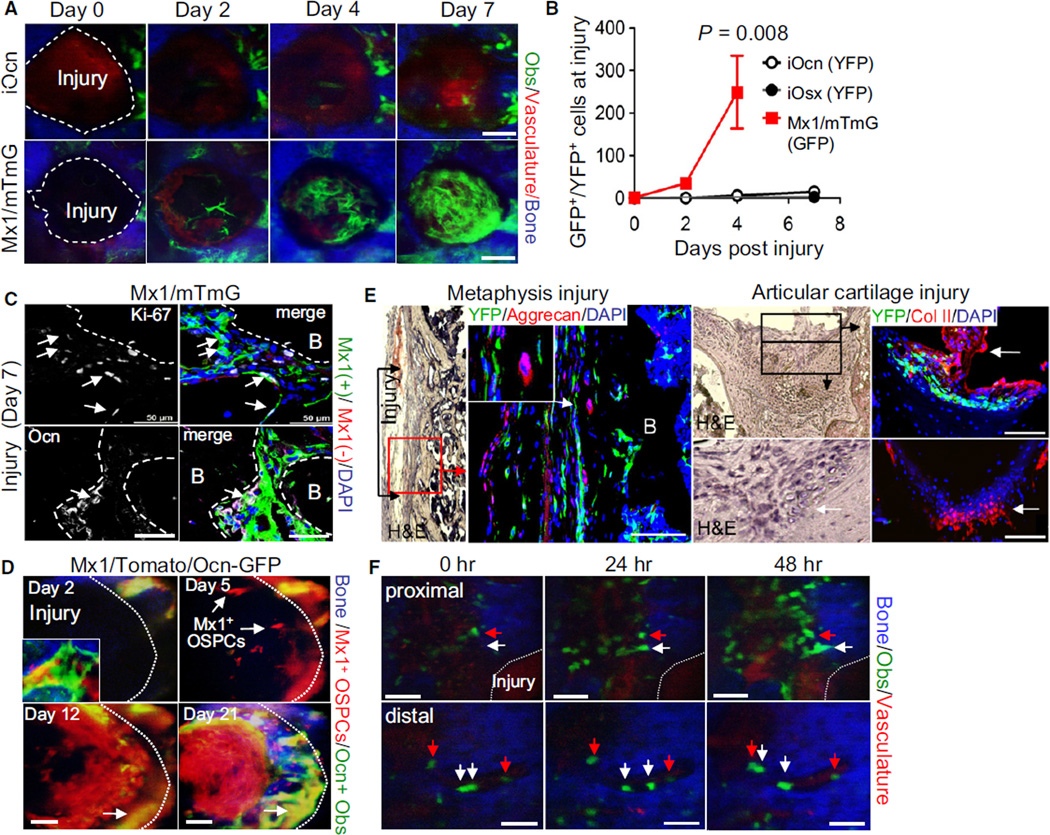
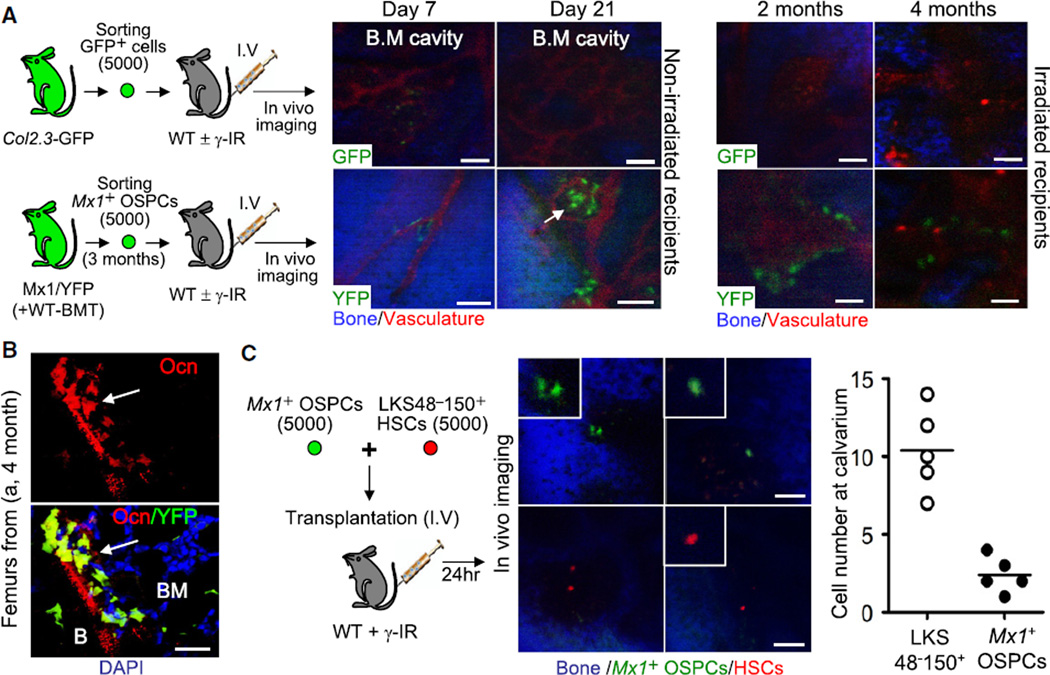
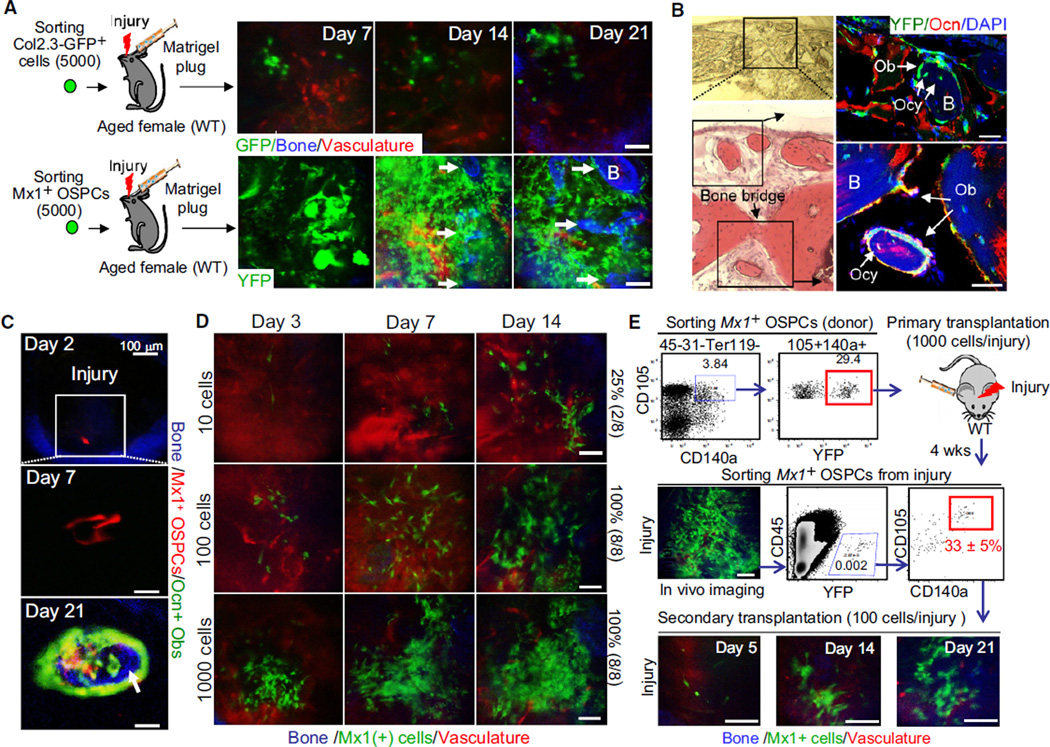
Mesenchymal stem cells (MSCs) commonly defined by in vitro functions have entered clinical application despite little definition of their function in residence. Here, we report genetic pulse-chase experiments that define osteoblastic cells as short-lived and nonreplicative, requiring replenishment from bone-marrow-derived, Mx1(+) stromal cells with "MSC" features. These cells respond to tissue stress and migrate to sites of injury, supplying new osteoblasts during fracture healing. Single cell transplantation yielded progeny that both preserve progenitor function and differentiate into osteoblasts, producing new bone. They are capable of local and systemic translocation and serial transplantation. While these cells meet current definitions of MSCs in vitro, they are osteolineage restricted in vivo in growing and adult animals. Therefore, bone-marrow-derived MSCs may be a heterogeneous population with the Mx1(+) population, representing a highly dynamic and stress responsive stem/progenitor cell population of fate-restricted potential that feeds the high cell replacement demands of the adult skeleton.


Figures

Figure 1
Figure 1. Mature osteocalcin+ Osteoblasts Turn Over Rapidly In Vivo without Evidence of Proliferation
(A) Preexisting osteoblasts were pulsed and chased using a transgenic mouse (iOcn mouse). YFP was induced by tamoxifen (4-OHT) injection (2 doses) at 4–6 weeks of age and Ocn/YFP+ osteoblasts were tracked by in vivo imaging at the indicated time points. (B) Intravital microscopy was used to scan a 2 mm × 2 mm region (X, Y) of mouse calvarial cavity (red box, left panel and magnification in right panel) in left frontal bone (F) near the intersection of the coronal (C.S.) and sagittal (S.S.) sutures (left). Bone collagen (blue), Ocn/YFP+ osteoblasts (green), and vasculature (red) in scanned area were mapped by acquiring a 3 × 3 grid of 3D stacks (X, Y, Z: 660 µm × 660 µm × 100 µm in depth). Four red boxes (L1–L4; 660 µm2 each) represent the site of image analysis over time. Diagram represents a simplistic cross section view of the calvarial cavity. (C) Ocn/YFP+ osteoblasts in L1 position of the same iOcn mouse were tracked at the indicated time points (top). Z-stack images (50–100 µm depth) were reconstructed for 3D image analysis (bottom). (D) The average number (L1–L4) of Ocn/YFP+ osteoblasts from different mice were plotted at the indicated times. Each symbol represents an individual mouse (n = 16, control; n = 4). (E) Ocn/YFP-labeled osteocytes within superficial calvarial bone from the same mouse in Figure 1C were imaged at several time points. (F) Proliferation of Ocn/YFP+ osteoblasts (YFP, green) was assessed four (Day 4) or seven (Day 7) days after 4-OHT treatment in the calvarial cavity of iOcn mice by anti-Ki-67 immunohistochemistry (Ki-67, red). Anti-GFP/YFP staining was used for enhancing YFP signal. Blue, DAPI. (G) Mature osteoblasts in the calvaria of iOcn/iDTR mice imaged at 14 days (Before DT) or after three daily doses (100 µg/dose) of diphtheria toxin (+DT) or PBS as a control (−DT). The number of labeled osteoblasts was sequentially tracked by intravital microscopy at the indicated time points. Representative consecutive images (left) and the average numbers of osteoblasts in 4–6 images (660 µm2/each) per mouse (n = 3/group) (right) are shown. Scale bars are 50 µm (F) or 100 µm (C, E, and G). Data represent at least three independent experiments (F). See also Figure S1.
Figure 2
Figure 2. Osterix+ Preosteoblasts Turn Over Rapidly In Vivo without Evidence of Proliferation
(A) Sequential imaging of Osterix+ preosteoblasts in iOsx mice induced with tamoxifen (+4-OHT) by injection at 4–6 weeks of age. Osx/YFP+ preosteoblasts were tracked by in vivo imaging. Scanned area covering the calvarial cavity and sagittal suture in the left frontal bone was mapped by acquiring a 3 × 2 grid of 3D stacks (X, Y, Z: 2 mm × 1.3 mm × 100 µm in depth). Two red boxes (660 µm2 each) represent the site of image analysis for tracing the number of preosteoblasts over time. Bone collagen (blue), Osx/YFP+ preosteoblasts (green), and vasculature (red) are shown. (B and C) Osx-induced preosteoblasts were tracked at the indicated time points by sequential imaging. The average numbers of Osx-induced preosteoblasts from different mice with (black circle, n = 10) or without (white circle, n = 4) 4-OHT treatment were plotted at the indicated times (C). Error bars, ± SD. (D) Proliferation of Osx-induced preosteoblasts on the periosteum near a suture (top) or on the endosteal surface (bottom) was assessed by anti-Ki-67 immunohistochemistry (red) fourteen days after 4-OHT treatment. Arrows indicate YFP and Ki-67 double-positive cells (yellow). (E) Continuous replacement of osteoblasts by new osteoblasts was assessed in iOcn mice 60 days after the first tamoxifen administration (left) and maintained for an additional 60 days. Newly labeled osteoblasts in the same position were reimaged at 14 days after the second tamoxifen administration (right) (n = 4). Scale bars are 20 µm (D) or 100 µm (B and E). Data represent three independent experiments with similar results (D). See also Figure S2.
Figure 3
Figure 3. Mx1-Induced Cells Have MSC Characteristics and Maintain Long-Term Repopulation of Osteoblasts In Vivo
(A) Mx1-induced osteogenic cells (YFP+) in calvaria (left) or femur sections (middle and right) of Mx1/YFP mice prepared 20 days after pIpC treatment (day 20) or 6 months after pIpC treatment (at 6–8 weeks after irradiation and wild-type bone marrow transplantation, +WT-BMT) were analyzed by undergoing intravital microscopy (left, blue, bone; green, Mx1-induced osteoblasts) or by being stained with anti-GFP/YFP (YFP), anti-osterix (Osx, for preosteoblasts), and anti-osteocalcin (Ocn, for mature osteoblasts) antibodies (right). (B) Labeling efficiency of osteoblasts by Mx1. From collagenase-treated bones of Mx1/Tomato/Ocn-GFP trigenic mice at 30 days after pIpC treatment following WT-BMT, the percentage of Mx1-induced (Tomato+GFP+) or noninduced (GFP+) osteoblasts was analyzed by flow cytometry. (C) Percentage of Mx1-induced osteoblasts (YFP+Ocn+) before (−pIpC) or after pIpC (+pIpC) treatment as analyzed by anti-GFP/YFP, anti-osteocalcin immunohistochemistry, and FACs of cells from femurs at the indicated time points (n = 5 per group, right panel). (D) Enrichment of clonogenic stromal cells in the CD105+CD140a+ fraction. From collagenase-treated wild-type bone cells, the nonhematopoietic fraction (CD45CD31Ter119) was further separated with CD105 and CD140a. Indicated fractions (A, B, and C) were sorted and their clonogenicity was analyzed by CFU-F assays (>50 cells/colony at 14 days) (right, n = 5). (E) Mx1-induced labeling in Mx1/YFP mice was examined using the same antibodies and analyzed as in Figure 3D. The percentage of YFP (box A) and YFP+ (box B) within CD105+CD140a+ cells was determined and these fractions were used for CFU-F assays (right, n = 4). (F) Multilineage differentiation potential of Mx1-induced clones was examined using single-cell-driven, clonally expanded Mx1-induced progenitors (Figure 3E, box B) that were further incubated with indicated condition medium or MSC medium (Control) for 28 days (n = 8). Cells were stained with Oil-Red for adipocytes (Adipogenic), Alizarin-Red for osteoblasts (Osteogenic), or Toluidine-blue for chondrocytes (Chondrogenic). NIH 3T3 fibroblasts cultured with conditioned medium were stained as a control (inserted images). (G) Eight weeks after lethal irradiation followed by wild-type marrow transplantation (WT-BMT), Mx1/mTmG mice were treated with five doses of pIpC every other day. After 90 days of further tracing, Mx1-induced (mGFP+, green) or Mx1-noninduced (mTomato+, red) osteoblasts from femur sections were analyzed by anti-osteocalcin (top right) or by anti-nestin immunohistochemistry (bottom). Red arrow indicates Mx1 and nestin double positive cells. Bone (B), bone marrow (BM), and osteoblasts (Ob) are indicated. Blue, DAPI (A and G). Numbers in the histogram indicate the average of 5–10 different analyses; error bars, ± SD (D and E). Scale bars are 20 µm (G). Data represent more than three independent experiments with comparable results (A and G). See also Figures S3 and S4.
Figure 4
Figure 4. Mx1-Induced Cells Are Osteogenic Stem/Progenitors and Do Not Contribute to the Maintenance of Other Bone Marrow Mesenchymal Cells In Vivo
(A) Femurs from recipient Mx1/YFP mice transplanted with wild-type bone marrow were analyzed before (−pIpC) or 20 days after 5 doses of pIpC from postnatal day 7 (+ pIpC at P7), and 40 days (day 40) or 6 months after five doses of pIpC at 6–8 weeks old (6 months + WT-BMT) for Mx1-induced progenitor contribution to chondrocytes (Ch) in articular cartilage. Sections were stained by anti-GFP/YFP and anti-Aggrecan antibodies (red), respectively. BM, bone marrow; B, bone; Ob, osteoblasts. (B) Mx1-induced progenitor contribution to adipocytes in outer surface (periosteal) or marrow (endosteal) of bones was assessed by immunostaining of femur sections with anti-GFP/YFP (green) and anti-perilipin antibody (red) and by Oil-Red staining (inserted images). Bones (B), bone marrow (BM), and skeletal muscle (SM) were indicated. Asterisk indicates adipocytes with lipid droplets. (C) Mx1-induced progenitors are perivascular and distinct from endothelial cells. Sections from Figure 4D were stained by anti-GFP/YFP (green) and anti-CD31 (red) antibodies. (D) By using dual reporter mice (mTmG) crossed with Mx1-cre mice, Mx1+ (green) or Mx1 (red) cells were analyzed by intravital microscopy of the calvaria (left) or by immunohistochemistry of femur sections (Growth plate and Cartilage) and skeletal muscle. Bone marrow (BM), chondrocyte (Ch), osteoblast (Ob), vessel, and endothelial cells (En) are indicated. To distinguish fibroblasts, anti-ER-TR7 staining (white) was included. Blue, DAPI (A–D). Scale bars are 20 µm (C) or 50 µm (A, B, and D). All data represent at least two (A, −pIpC) or three independent experiments with consistent results. See also Figure S5.
Figure 5
Figure 5. Migration and Proliferation of Mx1-Induced OSPCs, but Not Differentiated Osteoblasts, Supply the Majority of Osteoblasts in Fracture Healing
(A) Dramatic relocation of Mx1-induced OSPCs during fracture healing. YFP+ osteoblasts near the injury on iOcn (top) or Mx1/mTmG mouse calvaria (bottom) were imaged immediately after injury (day 0) and at the indicated times after injury. (B) The average numbers of Ocn-, Osx- or Mx1-labeled cells within the injury zone were plotted at the indicated time (n > 5 per group). Error bars, ± SD. (C) Mx1-induced OSPCs were assessed for proliferation by Ki-67 staining (white, top) and differentiation by anti-Ocn (white, bottom) seven days after injury from Figure 5A. Arrows indicate Mx1 and Ki-67 double positive cells (top) and Mx1 and Ocn double positive osteoblasts (bottom). Green, Mx1+ cells; red, Mx1- cells; white, Ki-67+ (top) or Ocn+ (bottom) cells; blue, DAPI. (D) Mx1-induced OSPCs and osteoblasts at the injury site on Mx1/Tomato/Ocn-GFP mouse calvaria were imaged at the indicated times after injury. An image in the bottom left corner of the day 2 image indicates osteogenic cells in uninjured bone. Arrows indicate newly translocated Mx1-induced OSPCs (day 5, red) and osteoblasts derived from Mx1+ OSPCs (day 12 and day 21, yellow). Blue, bone. (E) Three weeks after injury at distal metaphysis (left) and articular cartilage (right) of femurs in Mx1/YFP mice, Mx1-induced cells and chondrocytes at the site of microfractures were assessed by immunostaining with anti-GFP/YFP, anti-aggrecan (left), and anti-collagen type II (right, Col II) antibodies and by H&E staining of parallel sections. White arrows indicate newly generated chondrocytes. B, bone. (F) Mature osteoblasts assessed for mobility after injury. At 14 days after tamoxifen treatment, Ocn/YFP+ osteoblasts were imaged immediately (0 hr) or 24 hr and 48 hr after injury near (proximal; <400 µm) or over 400 µm away (distal) from the injury site. Arrows indicate stationary (red) and migrating (white) osteoblasts. Blue, bone; green, YFP+ osteoblasts; red, vasculature (Q-dots). Scale bars are 50 µm (C–F) or 100 µm (A). Data represent three (C and E) or five (A, D, and F) independent experiments (two to four injuries/each experiment) with comparable results. See also Figure S6.
Figure 6
Figure 6. Mx1-Induced OSPCs Are Transplantable by Intravenous Infusion
(A) Sorted Mx1-induced osteogenic stem/progenitors (bottom, 5,000 Mx1+ OSPCs from Figure 3E, box B) or control osteoblasts (top, 5,000 GFP+ cells from Col2.3-GFP mice) were transplanted intravenously into wild-type mice and were tracked in vivo by intravital microscopy at indicated time points (n = 3 to 5 mice per each group). (B) Osteoblast differentiation of transplanted Mx1+ OSPCs in femur sections from (A) (4 months) was tested by anti-osteocalcin staining (n = 3). (C) Relative homing efficiency of Mx1-induced osteogenic stem/progenitors. Sorted Mx1+ OPCs (5,000) and wild-type LinKit+Sca+CD48CD150+ HSPCs (5,000) stained with DiD (red) were mixed and transplanted intravenously into wild-type irradiated mice. Twenty-four hours later, the number of cells in bone marrow of calvaria was counted by intravital microscopy. An arrow in (A) indicates Mx1+ OSPCs in the bone marrow cavity. Scale bars are 20 µm (B) or 100 µm (A and C). Arrows in (B) indicate differentiated osteoblasts from donor cells. See also Figure S7.
Figure 7
Figure 7. Mx1-Induced OSPCs Contribute to Fracture Healing
(A) The same 5,000 Mx1+ OSPCs (bottom) or Col2.3-GFP+ osteoblasts (top) from Figure 6A were mixed with 20 µl of matrigel and transplanted at the site of calvarial injury (~1 mm diameter) of ~1-year-old wild-type female mice (Aged female). Transplanted cells and new bone formation were tracked by sequential in vivo imaging. (B) Osteoblast differentiation and new bone formation of transplanted Mx1-induced OSPCs at injury sites (day 21) was assessed by bright field (top left), H&E (bottom left), and anti-osteocalcin staining (right). Black boxes indicate the sites of newly generated bones by Mx1+ osteoblasts (Ob) and Mx1+ osteocytes (Ocy) derived from transplanted Mx1+ OSPCs. (C) A single Mx1-labeled OSPC from Mx1/Tomato/Ocn-GFP mice was transplanted into the calvarial injury of a wild-type mouse. Clonal expansion, osteogenic differentiation (Tomato+GFP+), and new bone formation (arrow, blue) were assessed by sequential in vivo imaging at the indicated times. (D) Engraftment frequency of Mx1+ OSPCs in injury was tracked by sequential in vivo imaging. Numbers at left are input cell number and the frequency of successful engraftment shown at the right. (E) Serial transplantation of Mx1+ OSPCs. Sorted Mx1+ OSPCs (red box on top scatterplot, 1,000 cells/injury, n = 8) were transplanted into injury sites of C57BL/6 recipients. Four weeks later, cells from the injury site were analyzed by in vivo imaging (middle, left), FACs-sorted (red box in middle right scatterplot), and retransplanted into secondary recipients (100 cells/injury, n = 3). The repopulation of Mx1+ OSPCs at secondary injuries was tracked by sequential in vivo imaging at indicated time points (bottom). Arrows in (A) and (C) indicate newly developed bones. Scale bars are 20 µm (B), 50 µm (C, D, and E), or 100 µm (A). Data represent 12 injuries (A) or three (C) independent experiments with comparable results.

Comment in

  • Special stem cells for bone.
    Zaidi M, Sun L, Blair HC. Zaidi M, et al. Cell Stem Cell. 2012 Mar 2;10(3):233-4. doi: 10.1016/j.stem.2012.02.012. Cell Stem Cell. 2012. PMID: 22385649

Similar articles

Cited by

References

    1. Bianco P, Robey PG, Simmons PJ. Mesenchymal stem cells: revisiting history, concepts, and assays. Cell Stem Cell. 2008;2:313–319. - PMC - PubMed
    1. Buch T, Heppner FL, Tertilt C, Heinen TJ, Kremer M, Wunderlich FT, Jung S, Waisman A. A Cre-inducible diphtheria toxin receptor mediates cell lineage ablation after toxin administration. Nat. Methods. 2005;2:419–426. - PubMed
    1. Caplan AI. Mesenchymal stem cells. J. Orthop. Res. 1991;9:641–650. - PubMed
    1. Caplan AI, Correa D. The MSC: An Injury Drugstore. Cell Stem Cell. 2011;9:11–15. - PMC - PubMed
    1. Chan CK, Chen CC, Luppen CA, Kim JB, DeBoer AT, Wei K, Helms JA, Kuo CJ, Kraft DL, Weissman IL. Endochondral ossification is required for haematopoietic stem-cell niche formation. Nature. 2009;457:490–494. - PMC - PubMed

Publication types