. 2012 Mar 2;10(3):284-98.
doi: 10.1016/j.stem.2012.02.004.

Functional antagonism between Sall4 and Plzf defines germline progenitors

Affiliations

Functional antagonism between Sall4 and Plzf defines germline progenitors

Robin M Hobbs et al. Cell Stem Cell. .

Abstract

Transcription factors required for formation of embryonic tissues often maintain their expression in adult stem cell populations, but whether their function remains equivalent is not clear. Here we demonstrate critical and distinct roles for Sall4 in development of embryonic germ cells and differentiation of postnatal spermatogonial progenitor cells (SPCs). In differentiating SPCs, Sall4 levels transiently increase and Sall4 physically interacts with Plzf, a transcription factor exclusively required for adult stem cell maintenance. Mechanistically, Sall4 sequesters Plzf to noncognate chromatin domains to induce expression of Kit, a target of Plzf-mediated repression required for differentiation. Plzf in turn antagonizes Sall4 function by displacing Sall4 from cognate chromatin to induce Sall1 expression. Taken together, these data suggest that transcription factors required for embryonic tissue development postnatally take on distinct roles through interaction with opposing factors, which hence define properties of the adult stem cell compartment.


Figures

Figure 1
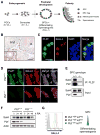
Figure 1. Characteristics of Sall4 expression and complex formation in germ cells
(A) Scheme illustrating key stages of embryonic and postnatal germ cell development in the male. Vertical dashed line indicates point of birth after which pools of SPCs and differentiating spermatogonia (Dffn Spg) are formed from precursor gonocytes. Approximate embryonic (E) and postnatal (PN) days of the stages are indicated. For details see main text. (B) IHC of adult and juvenile (inset - 2 weeks postnatal) wildtype testes for Sall4. The associated seminiferous tubule stages in the adult are indicated. Scale bar is 50μm. (C) Co-immunofluorescence staining of juvenile testis sections (2 weeks postnatal) for Plzf and Sall4. DNA is counterstained with DAPI (blue). Scale bar is 20μm. (D) Co-immunofluorescence staining of Plzf +/+ and Plzf −/− cultured SPC colonies for Plzf and Sall4. DNA is counterstained with DAPI (blue). Scale bar is 100μm. (E) Co-immunoprecipitation (IP) of endogenous Plzf and Sall4 in cultured SPCs. Negative control IP using Plzf −/− SPCs is indicated. (F) Plzf +/+ and Plzf −/− SPC lines treated with Retinoic acid (RA) for 0h (starting point), 24h and 48h analyzed by Western blot. (G) A comparison of Sall4 protein levels in the indicated spermatogonial populations from juvenile (2 weeks postnatal) wildtype testis by intracellular staining and flow cytometry analysis. Filled gray histogram profile indicates secondary antibody control. See also Figure S1.
Figure 2
Figure 2. Functional interaction of Sall4 with Plzf
(A) Co-immunoprecipitation of transfected SALL4A isoform with the indicated Xpress-tagged PLZF constructs from 293HEK cells using antibody clone 13G10 to PLZF. (B) Co-immunoprecipitation of transfected Xpress-tagged PLZF constructs with SALL4A and B isoforms from 293HEK cells using antibody to the SALL4 C-terminus. (C) TOP/FOP reporter luciferase assay of 293HEK cells transfected with the indicated constructs then left unstimulated or treated with recombinant Wnt3a. (D) Co-localization immunofluorescence analysis of NIH/3T3 cells transfected with Xpress-tagged PLZF constructs plus SALL4 isoforms. Images of transfected cell nuclei are shown counterstained with DAPI to show pericentric heterochromatic regions. PLZF plus ΔPOZ mutant were detected with αXpress antibody. (E) Immunofluorescence of Plzf +/+ and Plzf−/− SPC lines for endogenous Sall4. Scale bar is 20μm. (F) Localization of PLZF-SALL4 complexes in NIH/3T3 cells transfected with differing relative amounts of the two constructs. Representative images of cells transfected with a 3:1 ratio of PLZF to SALL4 (top panels) and with a 7:1 ratio of SALL4 to PLZF (bottom panels) are shown. Nuclei are counterstained with DAPI. See also Figure S2.
Figure 3
Figure 3. Stra8-Cre-mediated deletion of Sall4 in SPCs
(A) Hematoxylin and eosin stained sections from adult mice of the indicated genotypes (2 months old). Scale bar represents 50μm. (B) Representative IHC for Sall4 on testis sections from 2 month-old adult mice. Scale bar is 50μm. (C) Co-immunofluorescence staining of Sall4flox/flox Stra8-Cre+ adult testis sections (2 months old) for Plzf and Sall4. DNA is counterstained with DAPI (blue). Plzf positive cells that have lost Sall4 expression are indicated with asterisks. Scale bar is 20μm. (D) Details of Plzf and Sall4 localization in example cells from Sall4flox/flox Stra8-Cre+ testis sections stained as in (C). Upper and lower panels show cells that retained or lost Sall4 expression respectively. (E) Co-immunofluorescence staining of testis sections from postnatal day (PND) 3 and 7 Sall4flox/flox Stra8-Cre+ mice for Plzf and Sall4. DNA is counterstained with DAPI (blue). A group of Plzf positive cells that have lost Sall4 expression in PND7 testis are indicated. Scale bar is 20μm. (F) Quantification of the percentage of Plzf positive cells that co-express Sall4 scored from sections of testis stained as in (C) and (E) of the indicated postnatal ages (days/months). Genotypes: Control (Ctrl) mice - Sall4flox/flox Stra8-Cre (neonates and juveniles), Sall4flox/+ Stra8-Cre+ (adults); cKO - Sall4flox/flox Stra8-Cre+. 3 mice were analyzed per genotype and time point. Numbers of Plzf positive cells scored per mouse for the different postnatal ages: 3d >60; 7d >250; adults >70. Horizontal bars indicate mean percentages. (G) Hematoxylin and eosin stained sections from aged adult mice (8 months old). Asterisks indicate tubules showing germ cell loss. Scale bar represents 50μm. (H) Quantification of percentage of degenerating (Dgn) seminiferous tubules from Sall4flox/+ Stra8-Cre+ (Ctrl) and Sall4flox/flox Stra8-Cre+ (cKO) testis of the indicated postnatal ages (months). As illustrated in (G), degenerating tubules that show germ cell loss were scored from hematoxylin and eosin stained sections. 3 mice were analyzed per genotype and time point. >80 tubule cross sections were scored per mouse. Horizontal bars indicate mean values. (I) Section of 8-month-old Sall4flox/flox Stra8-Cre+ adult testis stained as in (C). A degenerating tubule is indicated (Dgn) that has accumulated Plzf positive, Sall4 negative cells (arrowheads) although Plzf positive, Sall4 negative cells are still present (asterisk). Scale bar is 20μm. See also Figure S3.
Figure 4
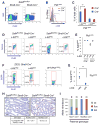
Figure 4. Testis phenotype of Sall4flox/flox Stra8-Cre+ mice
(A) Representative flow cytometric analysis of fixed and permeabilized testis cells from juvenile mice of the indicated genotypes (2 weeks postnatal) for Plzf. Percentage of cells contained within Plzf-positive gate are indicated. (B) Analysis of c-Kit expression by Plzf positive cell fraction from samples in (A). Gray filled histogram profile indicates isotype-stained control. (C) Frequency of indicated cell fractions amongst total testis cells of Sall4flox/flox Stra8-Cre and Sall4flox/flox Stra8-Cre+ juvenile mice (2 weeks postnatal) as determined by flow cytometry analysis. Mean values are shown ± SEM. 3 mice per genotype were analyzed. (D) Representative flow-cytometric analysis of Sall4 expression by Plzf-positive, c-Kit-negative and Plzf-positive, c-Kit-positive testis cell fractions from 2-week old mice of the indicated genotypes. Percentage of cells contained within respective gates is indicated. (E) Summary graph of percentage Sall4 positive cells contained within the indicated testis cell fractions from flow cytometric analysis as in (D). Horizontal bar indicates mean value. 3 mice per genotype were analyzed. (F) Representative flow-cytometric analysis of EGFP expression by Plzf positive, c-Kit negative and Plzf positive, c-Kit positive testis cell fractions from a 2-week old Z/EG; Stra8-Cre+ mouse. EGFP was detected with anti-GFP antibody as the fixation and permeabilization treatment disrupts inherent EGFP fluorescence. EGFP negative cells were gated according to autofluorescence levels of Plzf positive cells from a wildtype littermate mouse (WT). Percentage of cells contained within respective gates is indicated. (G) Summary graph of percentage EGFP negative cells contained within the Plzf positive, c-Kit negative and Plzf positive, c-Kit positive testis cell fractions from flow cytometric analysis as in (F). Horizontal bar indicates mean value (n = 3). (H) Representative TUNEL analysis of testis sections from 2 week-old mice. Mean percentage of tubule cross-sections containing TUNEL-positive cells is included in table below ± SEM. 4 mice were analyzed per genotype. Sall4flox/flox Stra8-Cre+ testis sections contain an increased percentage of TUNEL-positive tubules compared to Sall4flox/flox Stra8-Cre control testis (P < 0.02). Scale bar is 50μm. (I) Expected (E) and observed (O) genotype of Sall4 allele inherited in offspring sired from Sall4flox/+ Stra8-Cre+ and Sall4flox/flox Stra8-Cre+ males bred with wildtype females. 2 independent males of each genotype were used for breeding purposes. >60 offspring were genotyped per paternal genotype.
Figure 5
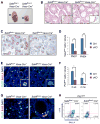
Figure 5. Testis phenotype of Sall4flox/Δ Vasa-Cre+ mice
(A) Representative images of testis (arrowheads) and associated epididymis from 2 month-old adult littermate mice of the indicated genotypes. (B) Hematoxylin and eosin stained sections from adult mice (2 months old). Detail of IHC staining for the germ cell maker Vasa is also shown at higher magnification (inset). Scale bar represents 50μm. (C) Representative IHC analysis for the germ cell marker Vasa on sections of testis harvested from mice on the day of birth (postnatal day 1). Scale bar represents 50μm. (D) Testis sections from Control (Sall4flox/+ Vasa-Cre+; Ctrl) and conditional knockout (Sall4flox/Δ Vasa-Cre+; cKO) mice of postnatal day (PND) 1 and 4 were subjected to IHC for Vasa as in (C). Graph indicates mean numbers of Vasa positive cells per tubule ± SEM. >70 tubule cross-sections were analyzed from duplicate mice for each genotype and age. (E) Co-immunofluorescence staining of juvenile testis sections (2 weeks postnatal) for Plzf (green) and Sall4 (red). DNA is counterstained with DAPI (blue). Insets show the detail of Plzf localization and Sall4 status in individual representative cells at higher magnification. Asterisks indicate tubules from conditional knockout testis that lack Plzf positive germ cells. Scale bar is 20μm. (F) Testis sections from 2-weeks or 2-months-old control (Ctrl; Sall4flox/+ Vasa-Cre+) and conditional knockout (cKO; Sall4flox/Δ Vasa-Cre+) mice were subjected to IHC for Plzf. Graph indicates mean numbers of Plzf positive cells per tubule cross-section ± SEM. Duplicate mice were analyzed for each genotype and age. >100 (juveniles) or >40 (adults) tubule cross-sections were scored per mouse. (G) Co-immunofluorescence staining of juvenile testis sections (2 weeks postnatal) for Plzf (green) and Phospho-Histone H3 (P-H3) (red). DNA is counterstained with DAPI (blue). Arrowheads indicate mitotic Plzf positive cells that co-stain for P-H3. Scale bar is 20μm. (H) Flow-cytometry analysis of testis cells from 2 weeks postnatal mice of the indicated Vasa-Cre genotypes. Cells were fixed, permeabilized and stained for Sall4, Plzf and c-Kit. The Plzf positive cell fraction is shown. Percentage of cells contained within respective gates is indicated. See also Figure S4.
Figure 6
Figure 6. Antagonistic co-regulation of Kit and Sall1 expression in SPCs by Sall4 and Plzf
(A) Western blot analysis of duplicate independently derived cultured lines of SPCs of the indicated Sall4 genotypes. (B) Gene expression analysis of SPC lines from (A) by quantitative RT-PCR. Mean mRNA levels of the indicated genes are normalized to those of β-actin and corrected so mRNA levels in the first wildtype cell line are equal to one. Standard deviations from duplicate reactions are shown. (C) Percentage of c-Kit positive cells within SPC cultures of the indicated genotypes treated with vehicle or 10−6M all-trans retinoic acid (RA) for 48h. c-Kit positive cells were identified by flow cytometry. Bar chart shows mean values from duplicate SPC lines ± SEM (*P < 0.05). (D) Representative flow-cytometry analysis of testis cells from 2 weeks postnatal Sall4flox/flox Stra8-Cre+ mice treated for 24h with vehicle or RA. Cells were fixed, permeabilized and stained for Sall4, Plzf and c-Kit. The Plzf-positive cell fraction is shown. Percentage of cells contained within respective gates is indicated. (E) Analysis of Sall1 mRNA expression in cultured SPC lines of the indicated genotypes by quantitative RT-PCR. Mean mRNA levels are normalized to those of β-actin and corrected so mRNA levels in the first wildtype cell line are equal to one. Standard deviations from duplicate reactions are shown. (F) Immunohistochemistry of 2 weeks postnatal Plzf +/+ and Plzf −/− littermate testis for Sall1. Scale bar is 50μm. (G) Quantitative RT-PCR analysis of Sall1 mRNA expression in distinct spermatogonial populations from testis of 2 weeks postnatal Plzf +/+ and Plzf −/− littermate mice. Mean mRNA levels are normalized to those of β-actin and corrected so mRNA levels present in unsorted wildtype testis cells are equal to one (not shown). Standard deviations from duplicate reactions are indicated. (H) Immunohistochemistry of wildtype testis of the indicated postnatal ages (days) for Sall1. Arrowheads indicate gonocytes present in immediately postnatal testis that express low level of Sall1. Scale bar is 50μm. See also Figure S5.
Figure 7
Figure 7. Model for role of Sall4 and Plzf in formation of a stable SPC pool
Diagram indicates proposed model for establishing and maintaining the SPC state by the relative levels and direct functional interaction of Sall4 and Plzf. Text indicates the distinct functions of Sall4 in embryonic versus postnatal/adult germ cells determined in this study. The induction of Sall1 and Kit in SPCs and differentiating (Dffn) SPCs respectively through Sall4 and Plzf interactions are shown. Sall4 may also potentially contribute to regulation of Kit expression at embryonic germ cell stages (dashed line + arrow). See main text for details.

References

    1. Anderson EL, Baltus AE, Roepers-Gajadien HL, Hassold TJ, de Rooij DG, van Pelt AM, Page DC. Stra8 and its inducer, retinoic acid, regulate meiotic initiation in both spermatogenesis and oogenesis in mice. Proc Natl Acad Sci U S A. 2008;105:14976–14980. - PMC - PubMed
    1. Barna M, Hawe N, Niswander L, Pandolfi PP. Plzf regulates limb and axial skeletal patterning. Nat Genet. 2000;25:166–172. - PubMed
    1. Barna M, Merghoub T, Costoya JA, Ruggero D, Branford M, Bergia A, Samori B, Pandolfi PP. Plzf mediates transcriptional repression of HoxD gene expression through chromatin remodeling. Dev Cell. 2002;3:499–510. - PubMed
    1. Buaas FW, Kirsh AL, Sharma M, McLean DJ, Morris JL, Griswold MD, de Rooij DG, Braun RE. Plzf is required in adult male germ cells for stem cell self-renewal. Nat Genet. 2004;36:647–652. - PubMed
    1. Cao D, Li J, Guo CC, Allan RW, Humphrey PA. SALL4 Is a Novel Diagnostic Marker for Testicular Germ Cell Tumors. Am J Surg Pathol 2009 - PubMed

Publication types

MeSH terms

Substances