Phosphate binder use and mortality among hemodialysis patients in the Dialysis Outcomes and Practice Patterns Study (DOPPS): evaluation of possible confounding by nutritional status
- PMID: 22385781
- PMCID: PMC3901075
- DOI: 10.1053/j.ajkd.2011.12.025
Phosphate binder use and mortality among hemodialysis patients in the Dialysis Outcomes and Practice Patterns Study (DOPPS): evaluation of possible confounding by nutritional status
Abstract
Background: Poor nutritional status and both hyper- and hypophosphatemia are associated with increased mortality in maintenance hemodialysis (HD) patients. We assessed associations of phosphate binder prescription with survival and indicators of nutritional status in maintenance HD patients.
Study design: Prospective cohort study (DOPPS [Dialysis Outcomes and Practice Patterns Study]), 1996-2008.
Setting & participants: 23,898 maintenance HD patients at 923 facilities in 12 countries.
Predictors: Patient-level phosphate binder prescription and case-mix-adjusted facility percentage of phosphate binder prescription using an instrumental-variable analysis.
Outcome: All-cause mortality.
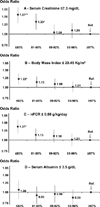
Results: Overall, 88% of patients were prescribed phosphate binders. Distributions of age, comorbid conditions, and other characteristics showed small differences between facilities with higher and lower percentages of phosphate binder prescription. Patient-level phosphate binder prescription was associated strongly at baseline with indicators of better nutrition, ie, higher values for serum creatinine, albumin, normalized protein catabolic rate, and body mass index and absence of cachectic appearance. Overall, patients prescribed phosphate binders had 25% lower mortality (HR, 0.75; 95% CI, 0.68-0.83) when adjusted for serum phosphorus level and other covariates; further adjustment for nutritional indicators attenuated this association (HR, 0.88; 95% CI, 0.80-0.97). However, this inverse association was observed for only patients with serum phosphorus levels ≥3.5 mg/dL. In the instrumental-variable analysis, case-mix-adjusted facility percentage of phosphate binder prescription (range, 23%-100%) was associated positively with better nutritional status and inversely with mortality (HR for 10% more phosphate binders, 0.93; 95% CI, 0.89-0.96). Further adjustment for nutritional indicators reduced this association to an HR of 0.95 (95% CI, 0.92-0.99).
Limitations: Results were based on phosphate binder prescription; phosphate binder and nutritional data were cross-sectional; dietary restriction was not assessed; observational design limits causal inference due to possible residual confounding.
Conclusions: Longer survival and better nutritional status were observed for maintenance HD patients prescribed phosphate binders and in facilities with a greater percentage of phosphate binder prescription. Understanding the mechanisms for explaining this effect and ruling out possible residual confounding require additional research.
Copyright © 2012 National Kidney Foundation, Inc. Published by Elsevier Inc. All rights reserved.
Figures


Comment in
-
Phosphorus binders in ESRD: consistent evidence from observational studies.Am J Kidney Dis. 2012 Jul;60(1):3-4. doi: 10.1053/j.ajkd.2012.04.007. Am J Kidney Dis. 2012. PMID: 22709595 No abstract available.
References
-
- Lopes AA, Elder SJ, Ginsberg N, et al. Lack of appetite in haemodialysis patients--associations with patient characteristics, indicators of nutritional status and outcomes in the international DOPPS. Nephrol Dial Transplant. 2007;22:3538–3546. - PubMed
-
- Leavey SF, Strawderman RL, Jones CA, Port FK, Held PJ. Simple nutritional indicators as independent predictors of mortality in hemodialysis patients. Am J Kidney Dis. 1998;31:997–1006. - PubMed
-
- Tentori F, Blayney MJ, Albert JM, et al. Mortality risk for dialysis patients with different levels of serum calcium, phosphorus, and PTH: the Dialysis Outcomes and Practice Patterns Study (DOPPS) Am J Kidney Dis. 2008;52:519–530. - PubMed
-
- Block GA, Hulbert-Shearon TE, Levin NW, Port FK. Association of serum phosphorus and calcium x phosphate product with mortality risk in chronic hemodialysis patients: a national study. Am J Kidney Dis. 1998;31:607–617. - PubMed
-
- Lopes AA, Bragg-Gresham JL, Elder SJ, et al. Independent and joint associations of nutritional status indicators with mortality risk among chronic hemodialysis patients in the Dialysis Outcomes and Practice Patterns Study (DOPPS) J Ren Nutr. 2010;20:224–234. - PubMed
Publication types
MeSH terms
Substances
Grants and funding
LinkOut - more resources
Full Text Sources
Other Literature Sources
Medical

