

Analysis of molecular movement reveals latticelike obstructions to diffusion in heart muscle cells
- PMID: 22385844
- PMCID: PMC3283817
- DOI: 10.1016/j.bpj.2012.01.012
Analysis of molecular movement reveals latticelike obstructions to diffusion in heart muscle cells
Abstract
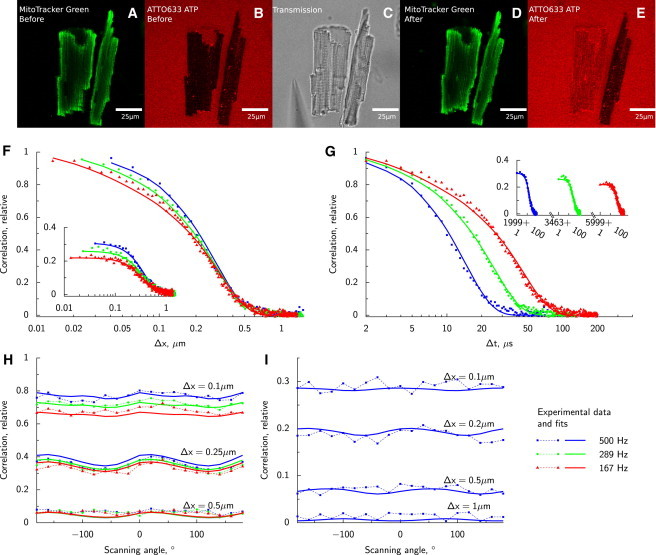
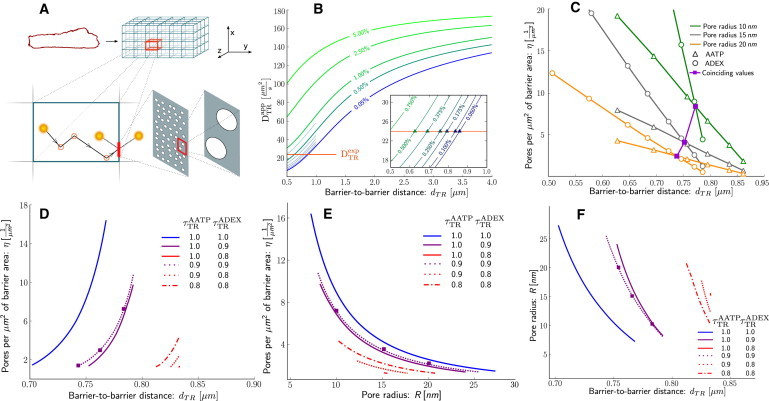
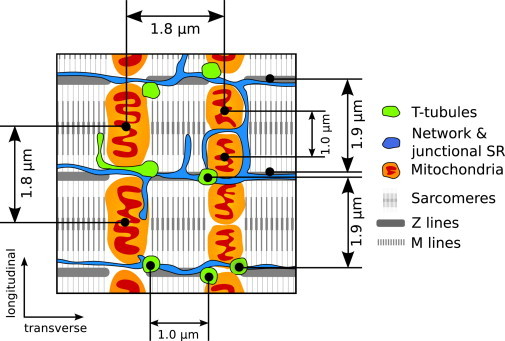
Intracellular diffusion in muscle cells is known to be restricted. Although characteristics and localization of these restrictions is yet to be elucidated, it has been established that ischemia-reperfusion injury reduces the overall diffusion restriction. Here we apply an extended version of raster image correlation spectroscopy to determine directional anisotropy and coefficients of diffusion in rat cardiomyocytes. Our experimental results indicate that diffusion of a smaller molecule (1127 MW fluorescently labeled ATTO633-ATP) is restricted more than that of a larger one (10,000 MW Alexa647-dextran), when comparing diffusion in cardiomyocytes to that in solution. We attempt to provide a resolution to this counterintuitive result by applying a quantitative stochastic model of diffusion. Modeling results suggest the presence of periodic intracellular barriers situated ∼1 μm apart having very low permeabilities and a small effect of molecular crowding in volumes between the barriers. Such intracellular structuring could restrict diffusion of molecules of energy metabolism, reactive oxygen species, and apoptotic signals, enacting a significant role in normally functioning cardiomyocytes as well as in pathological conditions of the heart.
Copyright © 2012 Biophysical Society. Published by Elsevier Inc. All rights reserved.
Figures
Similar articles
-
Anisotropic diffusion of fluorescently labeled ATP in rat cardiomyocytes determined by raster image correlation spectroscopy.Am J Physiol Cell Physiol. 2008 Nov;295(5):C1302-15. doi: 10.1152/ajpcell.00313.2008. Epub 2008 Sep 24. Am J Physiol Cell Physiol. 2008. PMID: 18815224 Free PMC article.
-
Restricted ADP movement in cardiomyocytes: Cytosolic diffusion obstacles are complemented with a small number of open mitochondrial voltage-dependent anion channels.J Mol Cell Cardiol. 2016 Aug;97:197-203. doi: 10.1016/j.yjmcc.2016.04.012. Epub 2016 May 31. J Mol Cell Cardiol. 2016. PMID: 27261153
-
Intracellular diffusion of adenosine phosphates is locally restricted in cardiac muscle.Mol Cell Biochem. 2004 Jan-Feb;256-257(1-2):229-41. doi: 10.1023/b:mcbi.0000009871.04141.64. Mol Cell Biochem. 2004. PMID: 14977184
-
Longitudinal diffusion barriers imposed by myofilaments and mitochondria in murine cardiac myocytes.J Gen Physiol. 2023 Oct 2;155(10):e202213329. doi: 10.1085/jgp.202213329. Epub 2023 Aug 9. J Gen Physiol. 2023. PMID: 37555782 Free PMC article.
-
Modeling oxygen requirements in ischemic cardiomyocytes.J Biol Chem. 2017 Jul 14;292(28):11760-11776. doi: 10.1074/jbc.M116.751826. Epub 2017 May 9. J Biol Chem. 2017. PMID: 28487363 Free PMC article.
Cited by
-
Enzyme localization, crowding, and buffers collectively modulate diffusion-influenced signal transduction: Insights from continuum diffusion modeling.J Chem Phys. 2015 Sep 7;143(9):094103. doi: 10.1063/1.4929528. J Chem Phys. 2015. PMID: 26342355 Free PMC article.
-
Respiration of permeabilized cardiomyocytes from mice: no sex differences, but substrate-dependent changes in the apparent ADP-affinity.Sci Rep. 2019 Aug 29;9(1):12592. doi: 10.1038/s41598-019-48964-x. Sci Rep. 2019. PMID: 31467353 Free PMC article.
-
Molecular and subcellular-scale modeling of nucleotide diffusion in the cardiac myofilament lattice.Biophys J. 2013 Nov 5;105(9):2130-40. doi: 10.1016/j.bpj.2013.09.020. Biophys J. 2013. PMID: 24209858 Free PMC article.
-
Universal Approach to FRAP Analysis of Arbitrary Bleaching Patterns.Sci Rep. 2015 Jun 25;5:11655. doi: 10.1038/srep11655. Sci Rep. 2015. PMID: 26108191 Free PMC article.
-
Rat and mouse cardiomyocytes show subtle differences in creatine kinase expression and compartmentalization.PLoS One. 2023 Nov 27;18(11):e0294718. doi: 10.1371/journal.pone.0294718. eCollection 2023. PLoS One. 2023. PMID: 38011179 Free PMC article.
References
-
- Verkman A.S. Solute and macromolecule diffusion in cellular aqueous compartments. Trends Biochem. Sci. 2002;27:27–33. - PubMed
-
- Kümmel L. Ca, Mg-ATPase activity of permeabilized rat heart cells and its functional coupling to oxidative phosphorylation of the cells. Cardiovasc. Res. 1988;22:359–367. - PubMed
-
- Kaasik A., Veksler V., Ventura-Clapier R. Energetic crosstalk between organelles: architectural integration of energy production and utilization. Circ. Res. 2001;89:153–159. - PubMed
Publication types
MeSH terms
Substances
Grants and funding
LinkOut - more resources
Full Text Sources
Other Literature Sources
Molecular Biology Databases
