

The ionic atmosphere around A-RNA: Poisson-Boltzmann and molecular dynamics simulations
- PMID: 22385854
- PMCID: PMC3283773
- DOI: 10.1016/j.bpj.2011.12.055
The ionic atmosphere around A-RNA: Poisson-Boltzmann and molecular dynamics simulations
Abstract
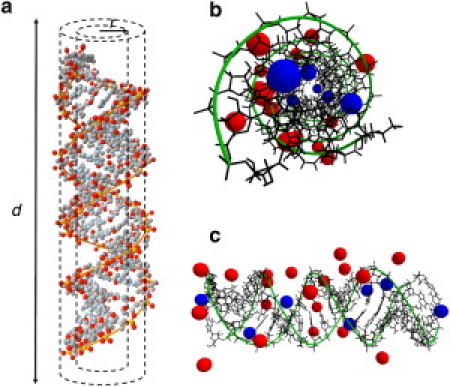
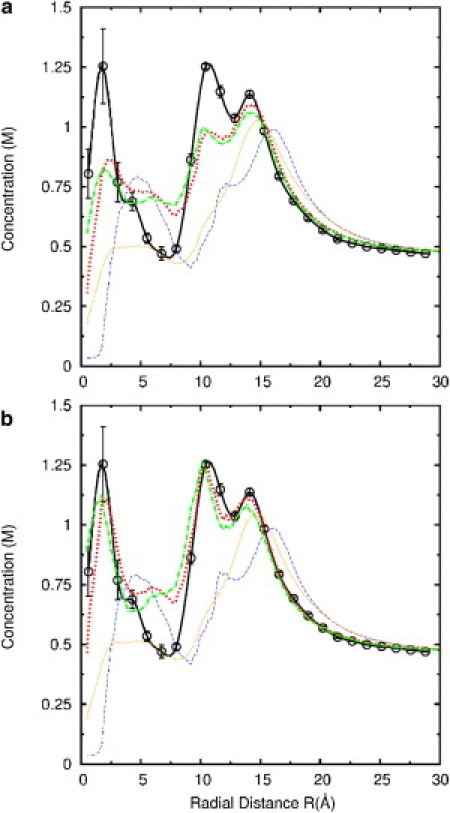
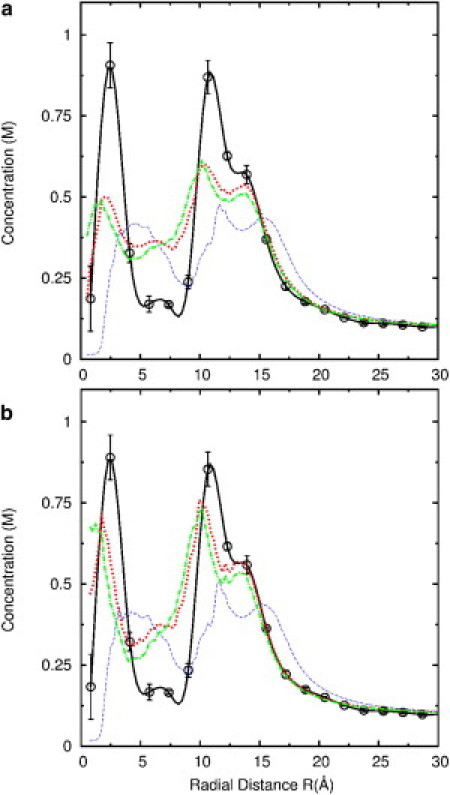
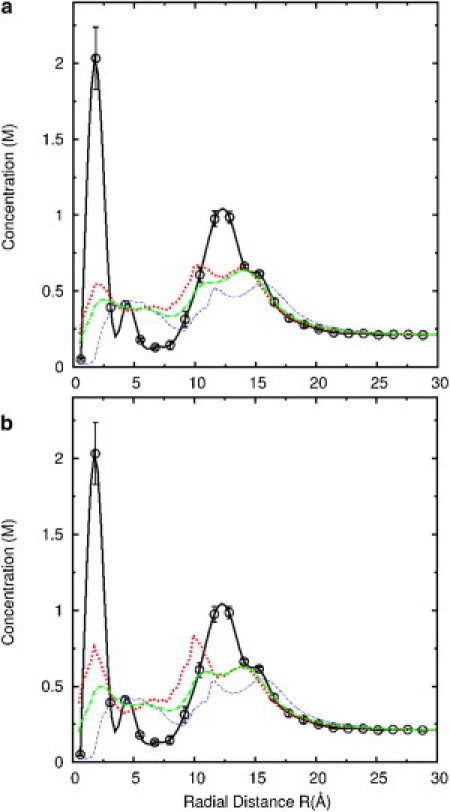
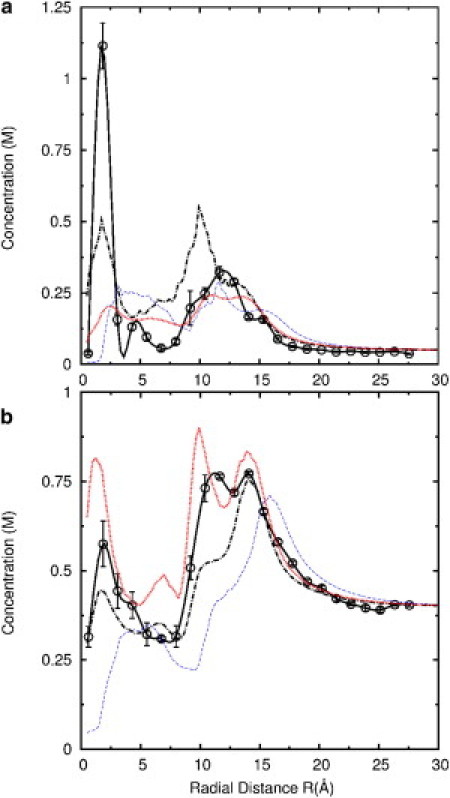
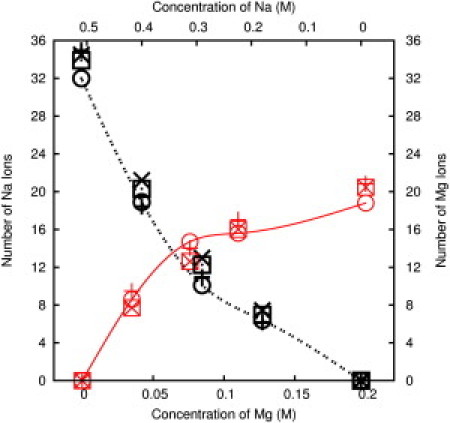
The distributions of different cations around A-RNA are computed by Poisson-Boltzmann (PB) equation and replica exchange molecular dynamics (MD). Both the nonlinear PB and size-modified PB theories are considered. The number of ions bound to A-RNA, which can be measured experimentally, is well reproduced in all methods. On the other hand, the radial ion distribution profiles show differences between MD and PB. We showed that PB results are sensitive to ion size and functional form of the solvent dielectric region but not the solvent dielectric boundary definition. Size-modified PB agrees with replica exchange molecular dynamics much better than nonlinear PB when the ion sizes are chosen from atomistic simulations. The distribution of ions 14 Å away from the RNA central axis are reasonably well reproduced by size-modified PB for all ion types with a uniform solvent dielectric model and a sharp dielectric boundary between solvent and RNA. However, this model does not agree with MD for shorter distances from the A-RNA. A distance-dependent solvent dielectric function proposed by another research group improves the agreement for sodium and strontium ions, even for shorter distances from the A-RNA. However, Mg(2+) distributions are still at significant variances for shorter distances.
Copyright © 2012 Biophysical Society. Published by Elsevier Inc. All rights reserved.
Figures
Similar articles
-
Comparison of monovalent and divalent ion distributions around a DNA duplex with molecular dynamics simulation and a Poisson-Boltzmann approach.Biopolymers. 2014 Aug;101(8):834-48. doi: 10.1002/bip.22461. Biopolymers. 2014. PMID: 24443090 Free PMC article.
-
Mediating role of multivalent cations in DNA electrostatics: an epsilon-modified Poisson-Boltzmann study of B-DNA-B-DNA interactions in mixture of NaCl and MgCl2 solutions.J Phys Chem B. 2009 Feb 19;113(7):2160-9. doi: 10.1021/jp809245a. J Phys Chem B. 2009. PMID: 19199702
-
Explicit ions/implicit water generalized Born model for nucleic acids.J Chem Phys. 2018 May 21;148(19):195101. doi: 10.1063/1.5027260. J Chem Phys. 2018. PMID: 30307229 Free PMC article.
-
Understanding nucleic acid-ion interactions.Annu Rev Biochem. 2014;83:813-41. doi: 10.1146/annurev-biochem-060409-092720. Epub 2014 Mar 5. Annu Rev Biochem. 2014. PMID: 24606136 Free PMC article. Review.
-
High-resolution reversible folding of hyperstable RNA tetraloops using molecular dynamics simulations.Proc Natl Acad Sci U S A. 2013 Oct 15;110(42):16820-5. doi: 10.1073/pnas.1309392110. Epub 2013 Sep 16. Proc Natl Acad Sci U S A. 2013. PMID: 24043821 Free PMC article. Review.
Cited by
-
Progress in developing Poisson-Boltzmann equation solvers.Mol Based Math Biol. 2013 Mar 1;1:10.2478/mlbmb-2013-0002. doi: 10.2478/mlbmb-2013-0002. Mol Based Math Biol. 2013. PMID: 24199185 Free PMC article.
-
Counting the ions surrounding nucleic acids.Nucleic Acids Res. 2017 Feb 28;45(4):1596-1605. doi: 10.1093/nar/gkw1305. Nucleic Acids Res. 2017. PMID: 28034959 Free PMC article.
-
Kinetic and thermodynamic analysis defines roles for two metal ions in DNA polymerase specificity and catalysis.J Biol Chem. 2021 Jan-Jun;296:100184. doi: 10.1074/jbc.RA120.016489. Epub 2020 Dec 17. J Biol Chem. 2021. PMID: 33310704 Free PMC article.
-
Grand canonical Monte Carlo and deep learning assisted enhanced sampling to characterize the distribution of Mg2+ and influence of the Drude polarizable force field on the stability of folded states of the twister ribozyme.J Chem Phys. 2024 Dec 14;161(22):225102. doi: 10.1063/5.0241246. J Chem Phys. 2024. PMID: 39665326
-
Why Does RNA Collapse? The Importance of Water in a Simulation Study of Helix-Junction-Helix Systems.J Am Chem Soc. 2018 Dec 12;140(49):16948-16951. doi: 10.1021/jacs.8b11111. Epub 2018 Nov 29. J Am Chem Soc. 2018. PMID: 30465606 Free PMC article.
References
-
- Yarus M. Harvard University Press; Cambridge, UK: 2011. Life from an RNA World: The Ancestor Within.
-
- Manning G.S. Limiting laws and counterion condensation in poly-electrolyte solutions. 8. Mixtures of counterions, specific selectivity, and valence selectivity. J. Phys. Chem. US. 1984;88:6654–6661.
-
- Manning G.S. The molecular theory of polyelectrolyte solutions with applications to the electrostatic properties of polynucleotides. Q. Rev. Biophys. 1978;11:179–246. - PubMed
-
- Manning G.S. Theory of the delocalized binding of Mg(II) to DNA: preliminary analysis for low binding levels. Biophys. Chem. 1977;7:141–145. - PubMed
Publication types
MeSH terms
Substances
Grants and funding
LinkOut - more resources
Full Text Sources
