. 2012 Feb 22;102(4):839-48.
doi: 10.1016/j.bpj.2012.01.022. Epub 2012 Feb 21.

Using DNA as a fiducial marker to study SMC complex interactions with the atomic force microscope

Affiliations

Using DNA as a fiducial marker to study SMC complex interactions with the atomic force microscope

M E Fuentes-Perez et al. Biophys J. .

Abstract

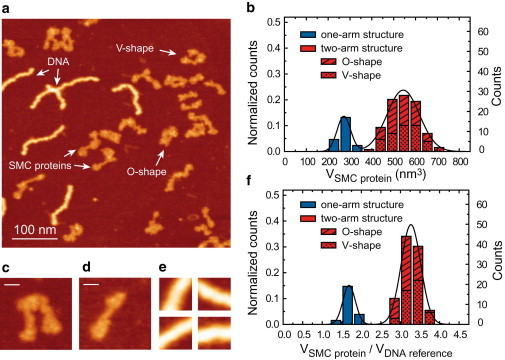
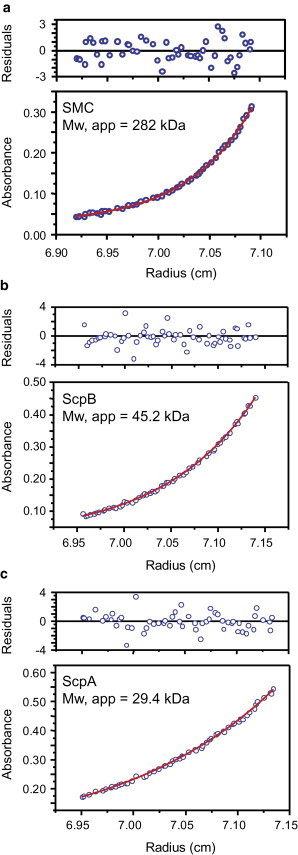
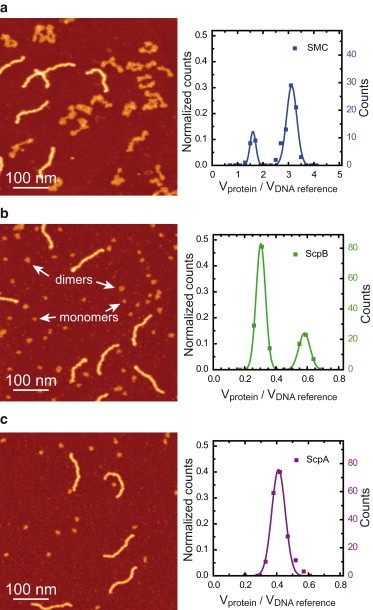
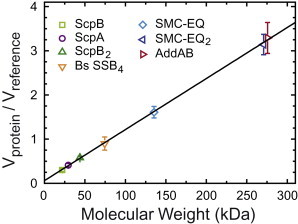
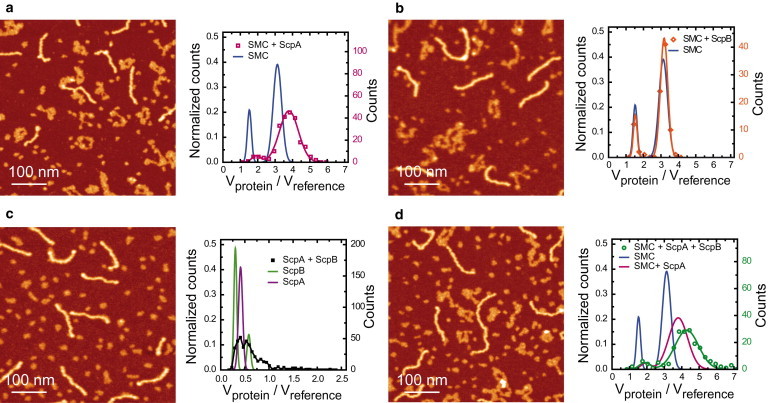
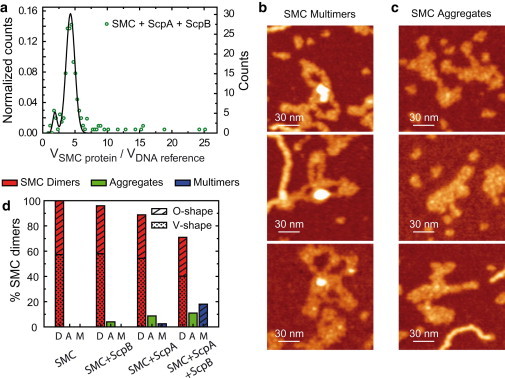
Atomic force microscopy can potentially provide information on protein volumes, shapes, and interactions but is susceptible to variable tip-induced artifacts. In this study, we present an atomic force microscopy approach that can measure volumes of nonglobular polypeptides such as structural maintenance of chromosomes (SMC) proteins, and use it to study the interactions that occur within and between SMC complexes. Together with the protein of interest, we coadsorb a DNA molecule and use it as a fiducial marker to account for tip-induced artifacts that affect both protein and DNA, allowing normalization of protein volumes from images taken on different days and with different tips. This approach significantly reduced the error associated with volume analysis, and allowed determination of the oligomeric states and architecture of the Bacillus subtilis SMC complex, formed by the SMC protein, and by the smaller ScpA and ScpB subunits. This work reveals that SMC and ScpB are dimers and that ScpA is a stable monomer. Moreover, whereas ScpA binds directly to SMC, ScpB only binds to SMC in the presence of ScpA. Notably, the presence of both ScpA and ScpB favored the formation of higher-order structures of SMC complexes, suggesting a role for these subunits in the organization of SMC oligomers.


Figures

Figure 1
Figure 1
Volumetric analysis of the SMC protein using DNA as a fiducial marker. (a) High-resolution AFM image of the SMC protein and fragments of DNA of 323 bp used as fiducial markers. (b) Histogram showing the volume of SMC proteins obtained without normalization with the DNA marker, as described in Materials and Methods and in Fig. S2 in the Supporting Material. (c) Example of a two-arm structure. (d) Example of a one-arm structure. (e) Panel with examples of 20 × 20 nm images used to measure the reference volume of DNA. (f) Histogram showing the normalized volume of SMC proteins by the reference volume. Two-arm SMC structures adopted either a V- or an O-shape conformation in approximately equal proportions (see arrows in panel a) and this information is included in panels b and f. The bar size in panels c and d is 15 nm. Color scale (from dark to bright) is 0–2 nm.
Figure 2
Figure 2
Analytical ultracentrifugation of SMC complex components. Representative analytical ultracentrifugation traces are shown for each component of the SMC complex: SMC (a), ScpB (b), and ScpA (c). The apparent molecular weights were determined by globally fitting data for three different concentrations of each protein to Eq. 1 as described in the Materials and Methods. The apparent molecular weights are in good agreement with the expected molecular weights for an SMC dimer (271 kDa), a ScpB dimer (44 kDa), and a ScpA monomer (30 kDa).
Figure 3
Figure 3
AFM volumetric analysis of SMC complex components. (a) AFM image (left) and histogram of normalized volumes (right) of the SMC polypeptide. Approximately 75% of the proteins considered (N = 94) fall into to the larger-volume peak. (b) AFM image (left) and histogram of normalized volumes (right) of ScpB proteins. (Arrows) Examples of ScpB monomers and dimers. Approximately 75% of proteins considered (N = 171) fall into the smaller-volume peak. (c) AFM image (left) and histogram of normalized volumes (right) of ScpA proteins (N = 185). Color scale (from dark to bright) is 0–2 nm in all AFM images.
Figure 4
Figure 4
Normalized protein volumes determined by AFM are nearly proportional to known molecular weights. The molecular weights of the proteins shown in this graph are described in Table S1 in the Supporting Material. They span from 22 to 300 kDa. Over this range, normalized volumes follow a linear relationship with molecular weights (Eq. 4). They display a slope of 11.5 ± 0.2 × 10−3 kDa−1 and an offset at zero mass of 0.06 ± 0.01.
Figure 5
Figure 5
Interactions between the components of the SMC complex. (a) AFM image (left) and histogram of normalized volumes (right) for mixtures of SMC and ScpA proteins (N = 226). ScpA binds to SMC as a monomer. (b) AFM image (left) and histogram of normalized volumes (right) for mixtures of SMC and ScpB proteins (N = 91). ScpB does not interact with SMC. (c) AFM image (left) and histogram of normalized volumes (right) for mixtures of ScpA and ScpB proteins (N = 253). A tail at high molecular weights corresponding to complexes involving both proteins was observed. (d) AFM image (left) and histogram of normalized volumes (right) for mixtures of SMC, ScpA, and ScpB proteins (N = 186). ScpB is incorporated into the SMC complex but only in the presence of ScpA. Color scale (from dark to bright) is 0–2 nm in all AFM images.
Figure 6
Figure 6
ScpA and ScpB promote formation of higher-order SMC complexes containing multiple SMC dimers. (a) Normalized volume histogram (as in Fig. 5d) showing an extended tail, which corresponds to structures with several SMC dimers. (b) Panel with examples of SMC multimers (see text for definition). (c) Panel with examples of SMC aggregates (see text for definition). (d) Fraction of SMC dimers (D), aggregates (A), and multimers (M) found in experiments with SMC; SMC and ScpB; SMC and ScpA; and SMC and ScpA and ScpB. The fraction of O- and V-shape SMC structures is also indicated in the histogram. Color scale (from dark to bright) is 0–2 nm.

References

    1. Binnig G., Quate C.F., Gerber C. Atomic force microscope. Phys. Rev. Lett. 1986;56:930–933. - PubMed
    1. Bustamante C., Keller D. Scanning force microscopy in biology. Phys. Today. 1995;48:32–38.
    1. Stroh C., Wang H., Hinterdorfer P. Single-molecule recognition imaging microscopy. Proc. Natl. Acad. Sci. USA. 2004;101:12503–12507. - PMC - PubMed
    1. van Noort J., Verbrugge S., Dame R.T. Dual architectural roles of HU: formation of flexible hinges and rigid filaments. Proc. Natl. Acad. Sci. USA. 2004;101:6969–6974. - PMC - PubMed
    1. Lia G., Indrieri M., Dunlap D. ATP-dependent looping of DNA by ISWI. J. Biophoton. 2008;1:280–286. - PMC - PubMed

Publication types

LinkOut - more resources