

Excitation spectra and brightness optimization of two-photon excited probes
- PMID: 22385865
- PMCID: PMC3283774
- DOI: 10.1016/j.bpj.2011.12.056
Excitation spectra and brightness optimization of two-photon excited probes
Abstract
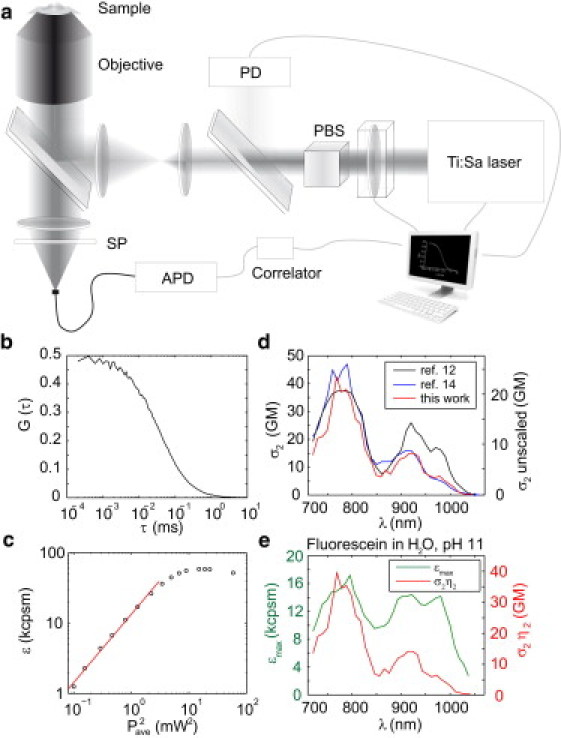
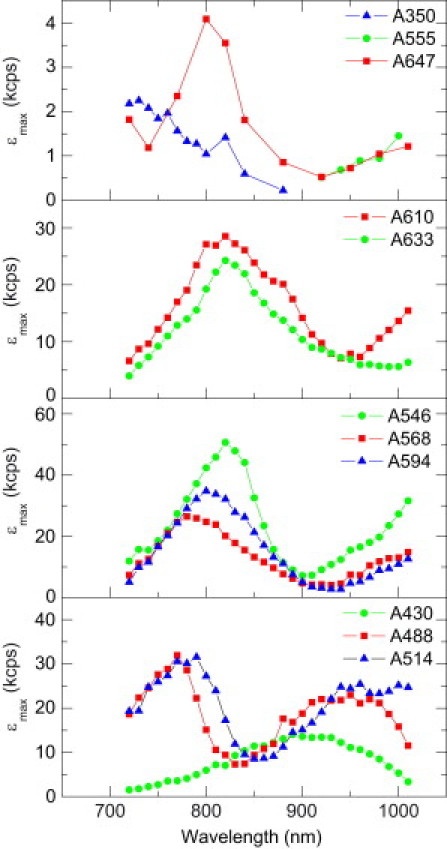
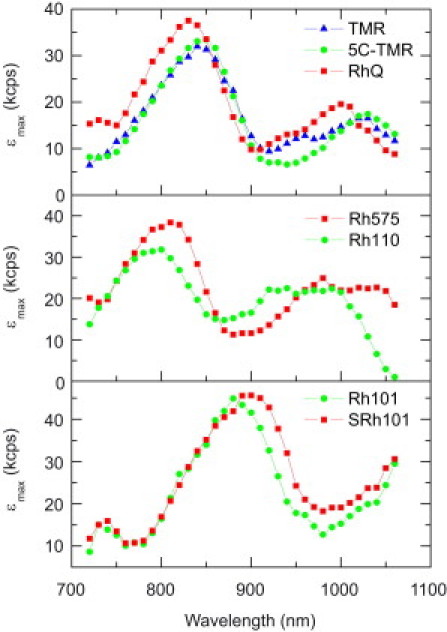
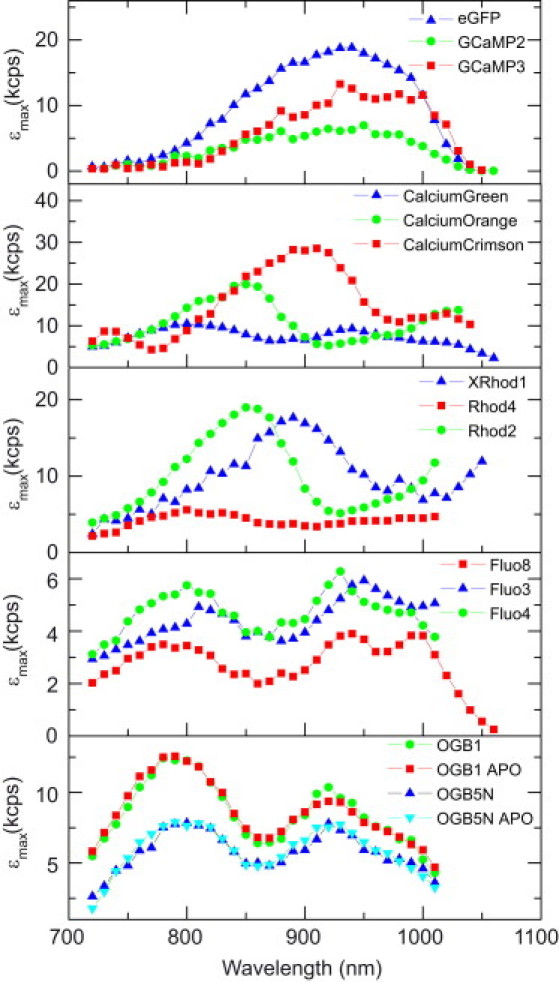
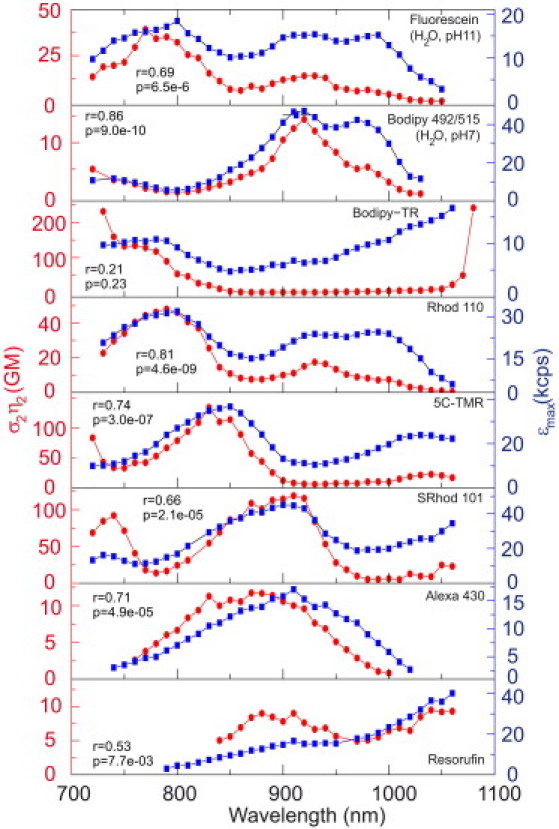
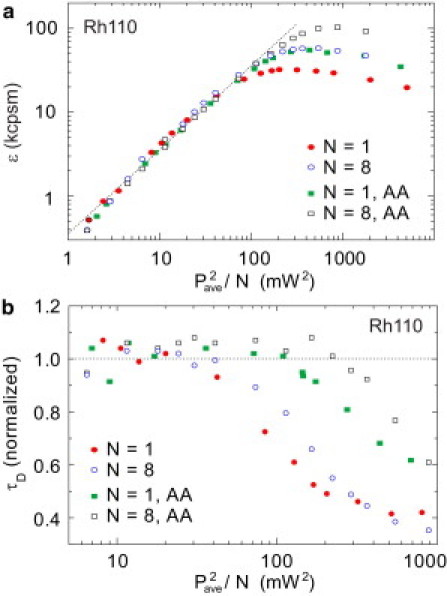
Two-photon probe excitation data are commonly presented as absorption cross section or molecular brightness (the detected fluorescence rate per molecule). We report two-photon molecular brightness spectra for a diverse set of organic and genetically encoded probes with an automated spectroscopic system based on fluorescence correlation spectroscopy. The two-photon action cross section can be extracted from molecular brightness measurements at low excitation intensities, while peak molecular brightness (the maximum molecular brightness with increasing excitation intensity) is measured at higher intensities at which probe photophysical effects become significant. The spectral shape of these two parameters was similar across all dye families tested. Peak molecular brightness spectra, which can be obtained rapidly and with reduced experimental complexity, can thus serve as a first-order approximation to cross-section spectra in determining optimal wavelengths for two-photon excitation, while providing additional information pertaining to probe photostability. The data shown should assist in probe choice and experimental design for multiphoton microscopy studies. Further, we show that, by the addition of a passive pulse splitter, nonlinear bleaching can be reduced--resulting in an enhancement of the fluorescence signal in fluorescence correlation spectroscopy by a factor of two. This increase in fluorescence signal, together with the observed resemblance of action cross section and peak brightness spectra, suggests higher-order photobleaching pathways for two-photon excitation.
Copyright © 2012 Biophysical Society. Published by Elsevier Inc. All rights reserved.
Figures
References
-
- Zipfel W.R., Williams R.M., Webb W.W. Nonlinear magic: multiphoton microscopy in the biosciences. Nat. Biotechnol. 2003;21:1369–1377. - PubMed
-
- Denk W., Strickler J.H., Webb W.W. Two-photon laser scanning fluorescence microscopy. Science. 1990;248:73–76. - PubMed
-
- Albota M.A., Xu C., Webb W.W. Two-photon fluorescence excitation cross sections of biomolecular probes from 690 to 960 nm. Appl. Opt. 1998;37:7352–7356. - PubMed
-
- Kauert M., Stoller P.C., Ricka J. Absolute measurement of molecular two-photon absorption cross-sections using a fluorescence saturation technique. Opt. Express. 2006;14:8434–8447. - PubMed
-
- Oulianov D.A., Tomov I.V., Rentzepis P.M. Observations on the measurement of two-photon absorption cross-section. Opt. Commun. 2001;191:235–243.
Publication types
MeSH terms
Substances
Grants and funding
LinkOut - more resources
Full Text Sources
Other Literature Sources
