. 2012 Apr 24;22(8):676-82.
doi: 10.1016/j.cub.2012.02.016. Epub 2012 Mar 1.

Protein synthesis during sleep consolidates cortical plasticity in vivo

Affiliations

Protein synthesis during sleep consolidates cortical plasticity in vivo

Julie Seibt et al. Curr Biol. .

Abstract

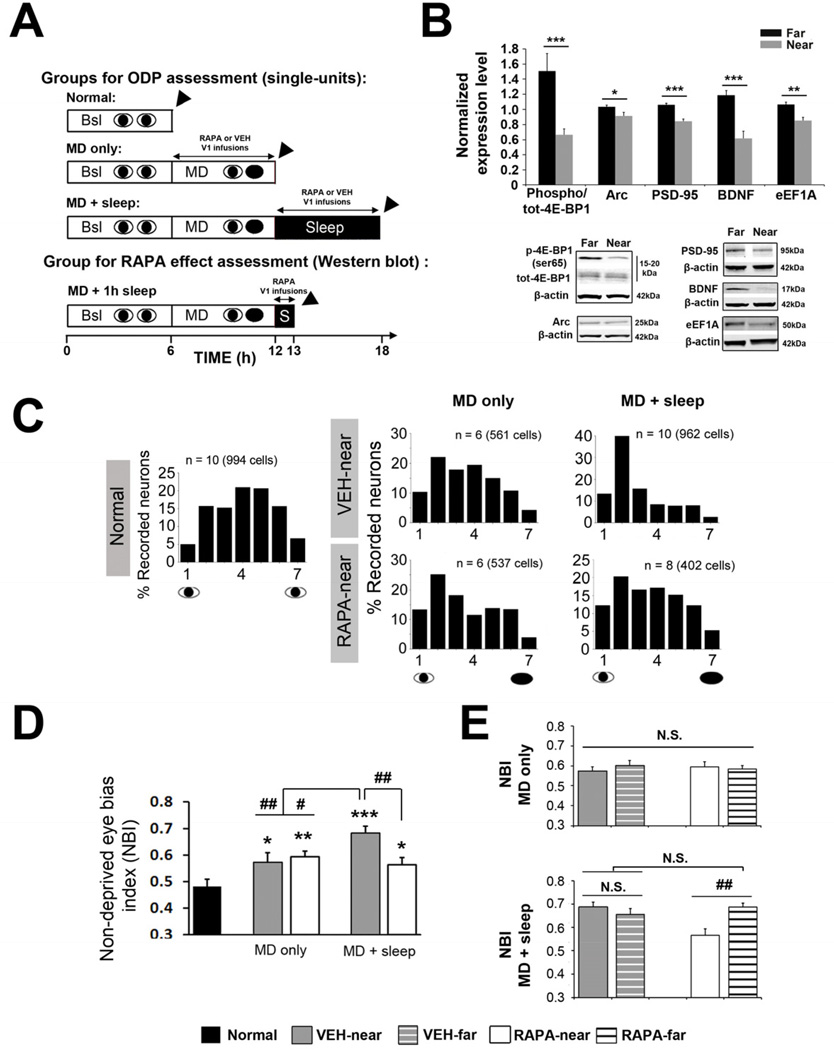
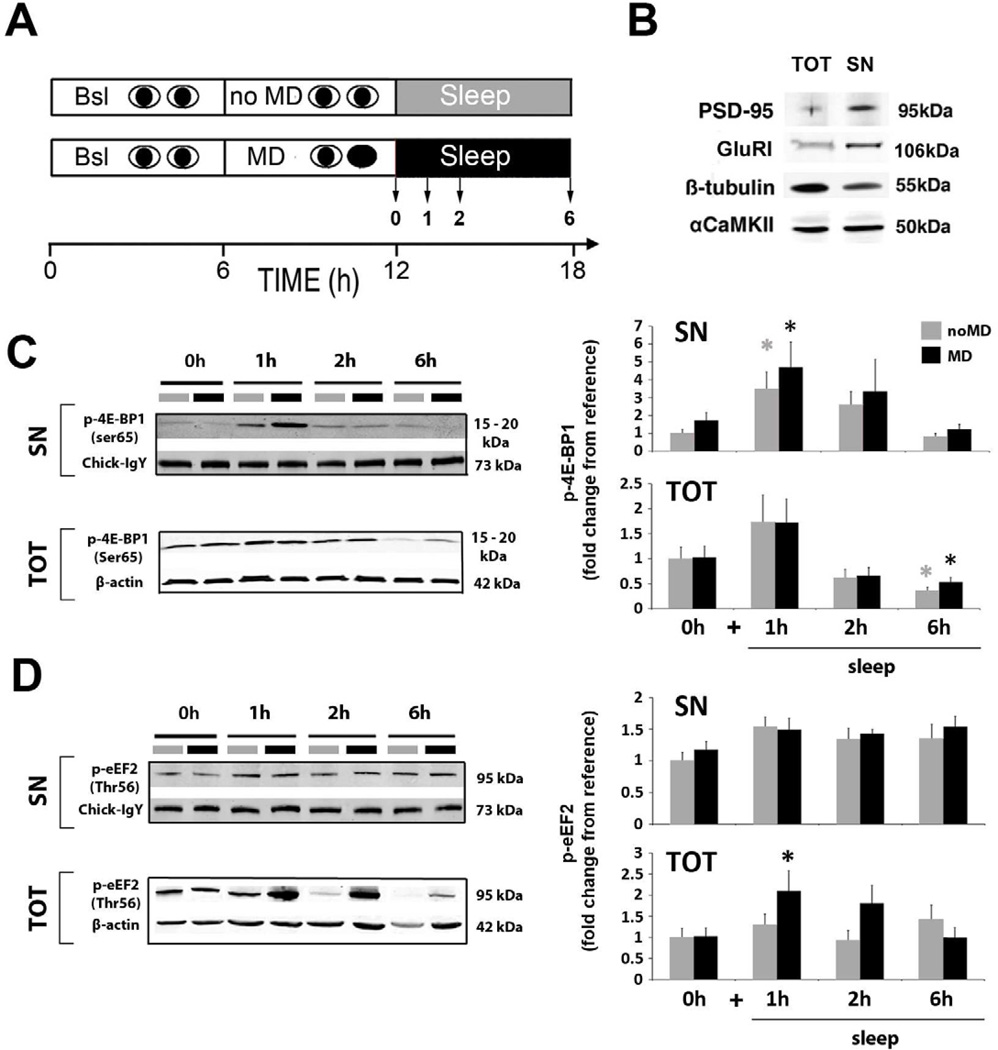
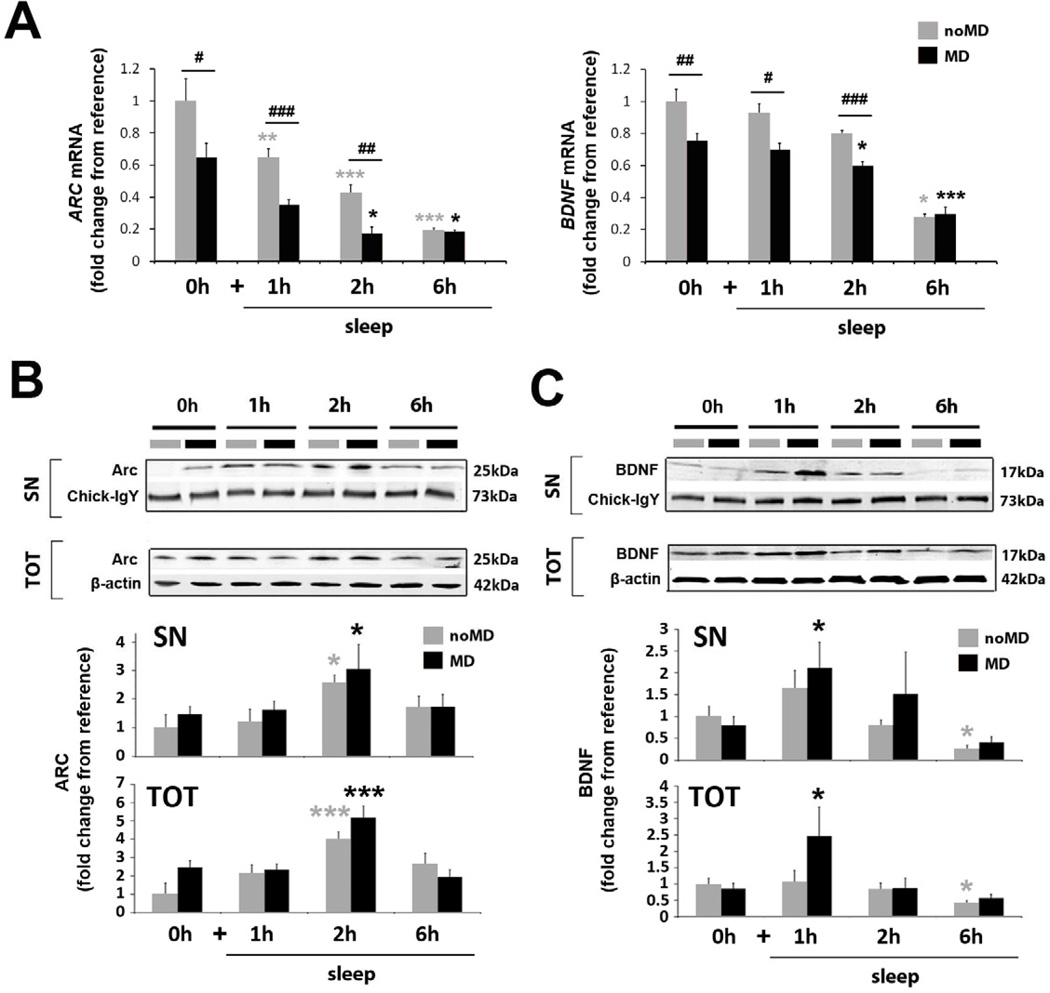
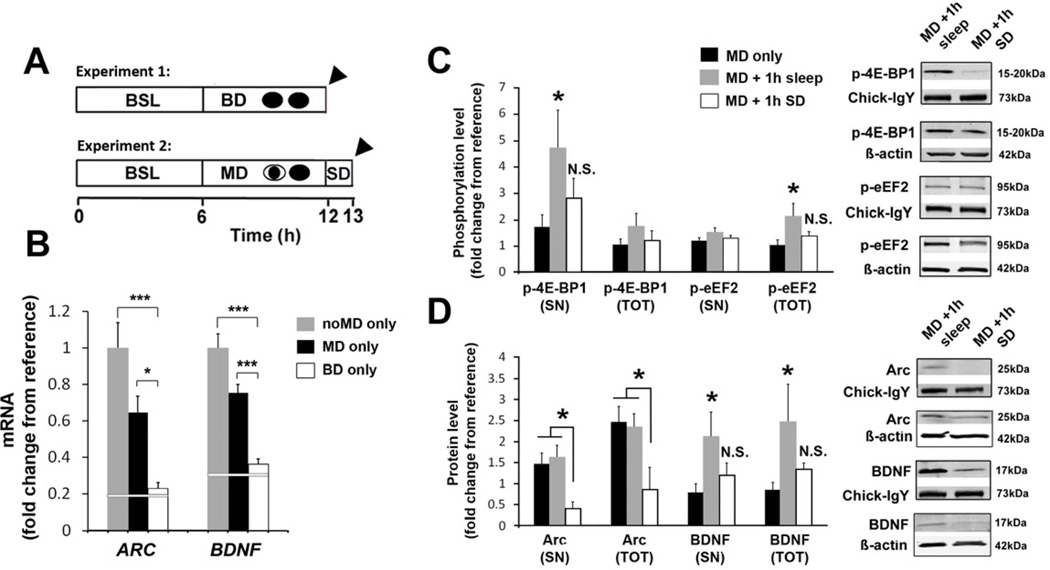
Sleep consolidates experience-dependent brain plasticity, but the precise cellular mechanisms mediating this process are unknown [1]. De novo cortical protein synthesis is one possible mechanism. In support of this hypothesis, sleep is associated with increased brain protein synthesis [2, 3] and transcription of messenger RNAs (mRNAs) involved in protein synthesis regulation [4, 5]. Protein synthesis in turn is critical for memory consolidation and persistent forms of plasticity in vitro and in vivo [6, 7]. However, it is unknown whether cortical protein synthesis in sleep serves similar functions. We investigated the role of protein synthesis in the sleep-dependent consolidation of a classic form of cortical plasticity in vivo (ocular dominance plasticity, ODP; [8, 9]) in the cat visual cortex. We show that intracortical inhibition of mammalian target of rapamycin (mTOR)-dependent protein synthesis during sleep abolishes consolidation but has no effect on plasticity induced during wakefulness. Sleep also promotes phosphorylation of protein synthesis regulators (i.e., 4E-BP1 and eEF2) and the translation (but not transcription) of key plasticity related mRNAs (ARC and BDNF). These findings show that sleep promotes cortical mRNA translation. Interruption of this process has functional consequences, because it abolishes the consolidation of experience in the cortex.


Figures

Figure 1
Figure 1. Cortical plasticity during sleep, but not wake, requires protein synthesis via mTORC1
(A) Experimental designs for the main groups. V1 was continuously infused for 6 hours with vehicle (VEH) or rapamycin (RAPA) in the “MD + sleep” and “MD only” groups during sleep or wake, respectively. In an additional group, RAPA was infused during 1h of post-MD sleep to measure the efficacy of RAPA on cortical mRNA translation (“MD + 1h sleep”). Arrowhead = ODP assessment (single-units) or tissue harvesting (Western Blot). (B) RAPA infusion during 1h post-MD sleep inhibits phosphorylation of the direct downstream target of mTORC1, 4E-BP1 and expression of several proteins implicated in synaptic plasticity (Arc, PSD-95, and BDNF) or translation regulator (eEF1A) (represented as normalized phospho/tot or expression level relative to “far” site, see Supplemental Experimental Procedures) near the infusion site (near vs. far, ***p < 0.001, **p < 0.01, *p < 0.05 t-test, n = 10 hemispheres). Representative Western blots are shown. (C) Ocular dominance (OD) histograms near the infusion site in “MD only” and “MD + sleep” groups infused with RAPA or VEH. OD histogram from “Normal” animals is on the left. N = Number of hemispheres (total number of neurons). (D) Quantitative scalar measure of OD. Non-deprived eye bias index (NBI) values calculated near the infusion site show that MD only induced a shift in ODP in favor of the NDE compared to animals with normal vision (Normal); this was unaffected by RAPA. A subsequent 6 hour ad lib sleep period further increases ODP in VEH infused animals but this was blocked in the RAPA group. 1-way ANOVA: F = 9.13, p < 0.001, vs. Normal: *** p < 0.001, ** p < 0.01, * p < 0.05; vs. MD + sleep VEH: ## p < 0.01, # p < 0.05, Holm-Sidak test. (E) NBI values near the RAPA infusion sites were reduced compared to far sites only in the “MD + sleep group” (1-way ANOVA: F = 5.43, p = 0.004, ## p < 0.01, Holm-Sidak test). No differences were found between near and far sites for VEH-and RAPA-infused hemispheres after “MD only infusion” (N.S.). All values are represented as means ± s.e.m.
Figure 2
Figure 2. Sleep and waking experience affect phosphorylation of translation factors
(A) Experimental design for the main groups: MD (black bars) or normal binocular vision (noMD control: grey bars) was combined with 0 (i.e. MD only and noMD only) or 1, 2 or 6 hours ad lib sleep. V1 was then harvested and processed separately for total mRNA extraction (see Figure 3A) and total (TOT) / synaptoneurosome (SN) protein extraction. (B) Validation of synaptoneurosome enrichment. Representative immunoblots showing enrichment of PSD-95 and GluRI protein level [37], decreased ß-tubulin [38] and unchanged αCaMKII [39] expression in the SN preparation compared to total protein extract in the same V1 sample. Equal amounts (40μg) of protein were loaded for both fractions. (C,D) Representative Western bots (left panels) and quantification of pooled data (right graphs) showing changes in phosphorylation state for 4E-BP1 (C) and eEF2 (D) in SN and TOT protein fractions. (C) Translation initiation, via 4E-BP1 phosphorylation (Ser65), increased in the first hour of sleep in both noMD and MD groups, but this was only significant in the SN fraction (1-Way ANOVA: noMD groups: H = 15.33, p = 0.002; MD groups, H = 12.75, p = 0.005, * p < 0.05 Dunn’s test). In the TOT fraction there was a significant decrease in p-4E-BP1 after 6 hours of sleep compared to wake in both noMD and MD groups (1-way ANOVA: noMD groups, H = 11.69, p = 0.009; MD groups, H = 10.24, p = 0.017, * p < 0.05 Dunn’s test). (D) Translation elongation arrest, via eEF2 phosphorylation (Thr56), was enhanced after MD+1h sleep, in the TOT fraction, but not in synaptic enriched fractions (1-Way ANOVA: MD groups, H = 11.29, p = 0.01, * p < 0.05, Dunn’s test). Normalizing procedures are described in Supplemental Experimental Procedure. Between 8–20 samples were used per condition (Table S3 for details). All values are represented as means ± s.e.m.
Figure 3
Figure 3. Sleep promotes translation, but not transcription, of ARC and BDNF
(A) Quantitative PCR for ARC and BDNF (experimental designs shown in Figure 2A). ARC and BDNF expression are reduced during sleep in both noMD and MD animals compared to wake (1-Way ANOVA: noMD groups, H = 24.60, p < 0.001 and H = 21.64, p < 0.001 for ARC and BDNF respectively; MD groups, H = 25.89, p < 0.001 and F = 17.63, p < 0.001 for ARC and BDNF respectively; *** p < 0.001, ** p < 0.01, * p < 0.05, Holm-Sidak or Dunn’s test where appropriate). ARC and BDNF expression are reduced by MD compared to noMD animals during wakefulness and in hours 1 and 2 of the ad lib sleep period (### p < 0.001, ## p < 0.01, #p < 0.05; t-test or Mann-Whitney test where appropriate). (B, C) Representative Western blots and quantification of pooled data for ARC (B) and BDNF (C) in SN and TOT protein fractions. (B) ARC protein in both SN and TOT fractions significantly increased in the second hour of sleep (1-way ANOVA, noMD group: TOT: F = 5.17, p = 0.005, SN: H = 8.97, p = 0.003, MD group: TOT: F = 10.17, p ≤ 0.001, SN: H = 9.2, p = 0.34, *** p < 0.001, * p < 0.05, Holm-Sidak or Dunn’s test where appropriate). (C) BDNF protein in both SN and TOT fractions significantly increased in the first hour of post-MD sleep (1-way ANOVA, TOT: H = 12.08, p = 0.007, SN: H = 12.45, p = 0.006, * p < 0.05, Dunn’s test), and declined after 6h of sleep in both groups-significantly in the noMD group relative to waking (1-way ANOVA, TOT: H = 8.14, p = 0.043, SN: H = 15.87, p = 0.001, * p < 0.05, Dunn’s test). Normalizing procedures are described in Supplemental Experimental Procedures. Between 8–16 samples were used per condition (Table S4 for details). All values are represented as means ± s.e.m.
Figure 4
Figure 4. Visual experience triggers mRNA transcription but translation requires sleep
(A) Experimental designs. In experiment 1, the role of patterned visual input in ARC and BDNF transcription was assessed. Instead of MD, animals underwent 6 hours of binocular deprivation (BD only) while awake. In experiment 2, the necessity of sleep in cortical protein synthesis was assessed. The MD period was followed by 1hour of sleep deprivation (SD) in complete darkness (to prevent any additional visual input) prior to sacrifice (MD+1h SD). Arrowheads = V1 tissue harvest for mRNA (BD) or protein (SN/TOT) extraction (MD + 1h SD). (B) ARC and BDNF mRNA levels were reduced in the BD only group compared to the MD only and noMD only group (values are reproduced from Figure 3) (1-way ANOVA, ARC: F = 7.67, p = 0.002; BDNF: F = 18.57, p< 0.001; *** p< 0.001, * p< 0.05, Holm-Sidak test). White reference line represents mean values from animals that slept 6 hours after the waking period (averaged from the noMD+6h sleep and MD+6h sleep groups shown in Figure 3). (C) Phosphorylation of 4E-BP1 in SN and eEF2 in TOT fraction is prevented by SD (white bars) (1-way ANOVA, p-4E-BP1-SN: H = 8.76, p = 0.013; p-eEF2-TOT: H = 8.29, p = 0.016, * p < 0.05 Dunn’s test). (D) Increases in SN and TOT BDNF protein observed after sleep do not occur after SD (white bars) (1-way ANOVA, BDNF-SN: H = 6.93, p = 0.031; BDNF-TOT: H = 8.39, p = 0.015, * p < 0.05 Dunn’s test). ARC protein in TOT and SN fractions was also decreased in the MD + 1h SD group compared to MD only and MD+1h sleep (1-way ANOVA, TOT: F = 3.56, p = 0.041; SN: F = 3.74, p = 0.036, * p < 0.05 Holm-Sidak test). For (C) and (D), MD only group and MD+1 h sleep values are reproduced from Figures 2 and 3. Next to each graph are representative corresponding Western blots. ARC and BDNF mRNA levels were not significantly different in the MD + 1h SD group to levels observed after 1h of sleep (Figure S4C). Normalizing procedures for changes in mRNA and protein expression (represented as means ± s.e.m.) are described in Supplemental Experimental Procedures. Between 6–16 samples were used per condition (see Tables S3 and S4 for details). All values are represented as means ± s.e.m.

References

    1. Frank MG, Benington JH. The role of sleep in memory consolidation and brain plasticity: dream or reality? Neuroscientist. 2006;12:477–488. - PubMed
    1. Ramm P, Smith CT. Rates of cerebral protein synthesis are linked to slow wave sleep in the rat. Physiol. Behav. 1990;48:749–753. - PubMed
    1. Nakanishi H, Sun Y, Nakamura RK, Mori K, Ito M, Suda S, Namba H, Storch FI, Dang TP, Mendelson TW, et al. Positive correlations between cerebral protein synthesis rates and deep sleep in Macaca mulatta. Eur. J. Neurosci. 1997;9:271–279. - PubMed
    1. Cirelli C, Gutierrez CM, Tononi G. Extensive and divergent effects of sleep and wakefulness on brain gene expression. Neuron. 2004;41:35–43. - PubMed
    1. Mackiewicz M, Shockley KR, Romer MA, Galante RJ, Zimmerman JE, Naidoo N, Baldwin DA, Jensen ST, Churchill GA, Pack AI. Macromolecule biosynthesis: a key function of sleep. Physiol. Genomics. 2007;31:441–457. - PubMed

Publication types

Substances

LinkOut - more resources