

Distinct regulatory mechanisms and functions for p53-activated and p53-repressed DNA damage response genes in embryonic stem cells
- PMID: 22387025
- PMCID: PMC3327774
- DOI: 10.1016/j.molcel.2012.01.020
Distinct regulatory mechanisms and functions for p53-activated and p53-repressed DNA damage response genes in embryonic stem cells
Abstract
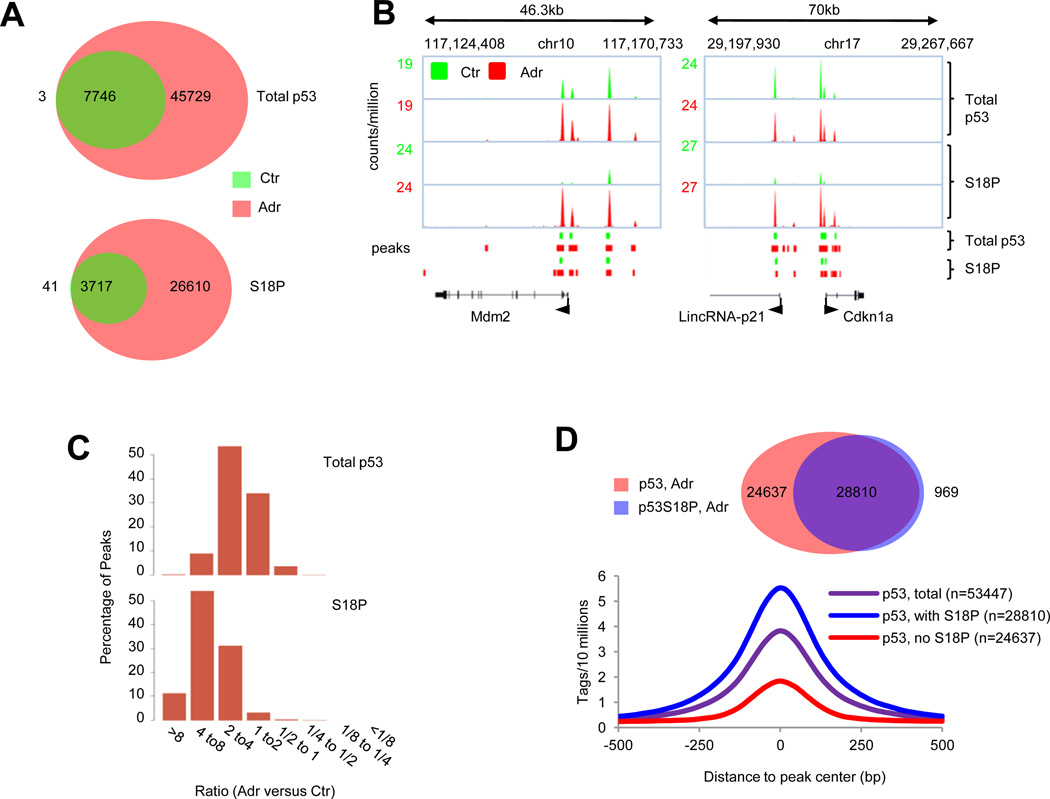
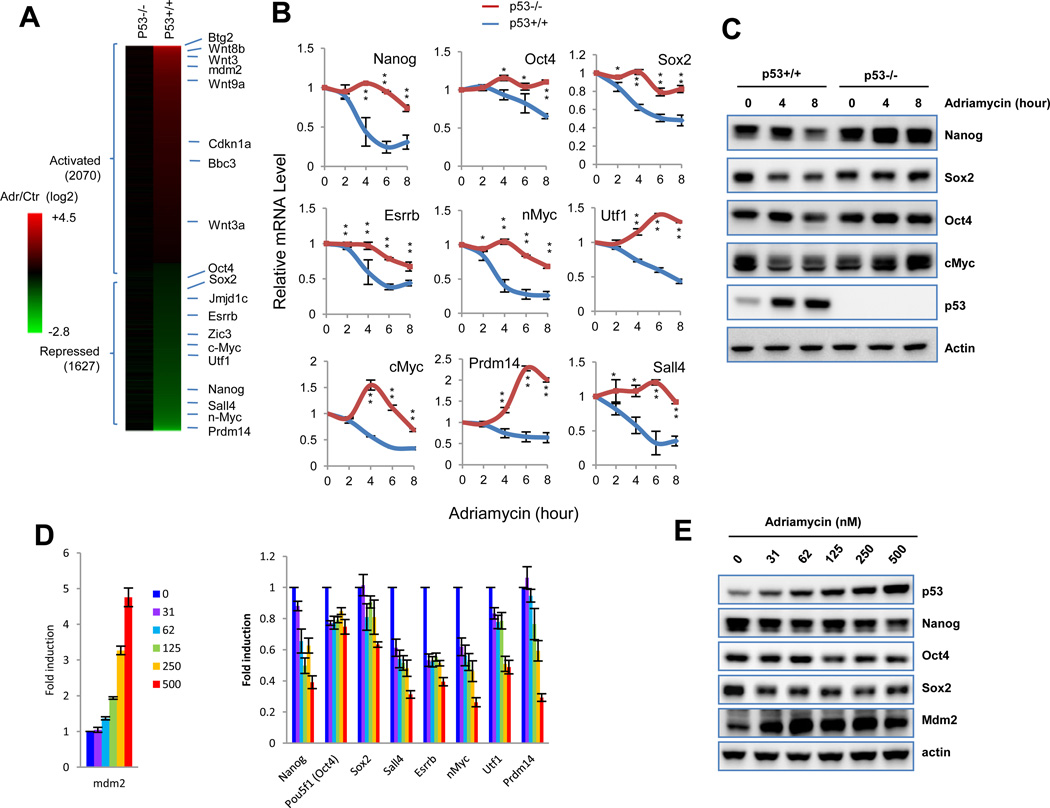
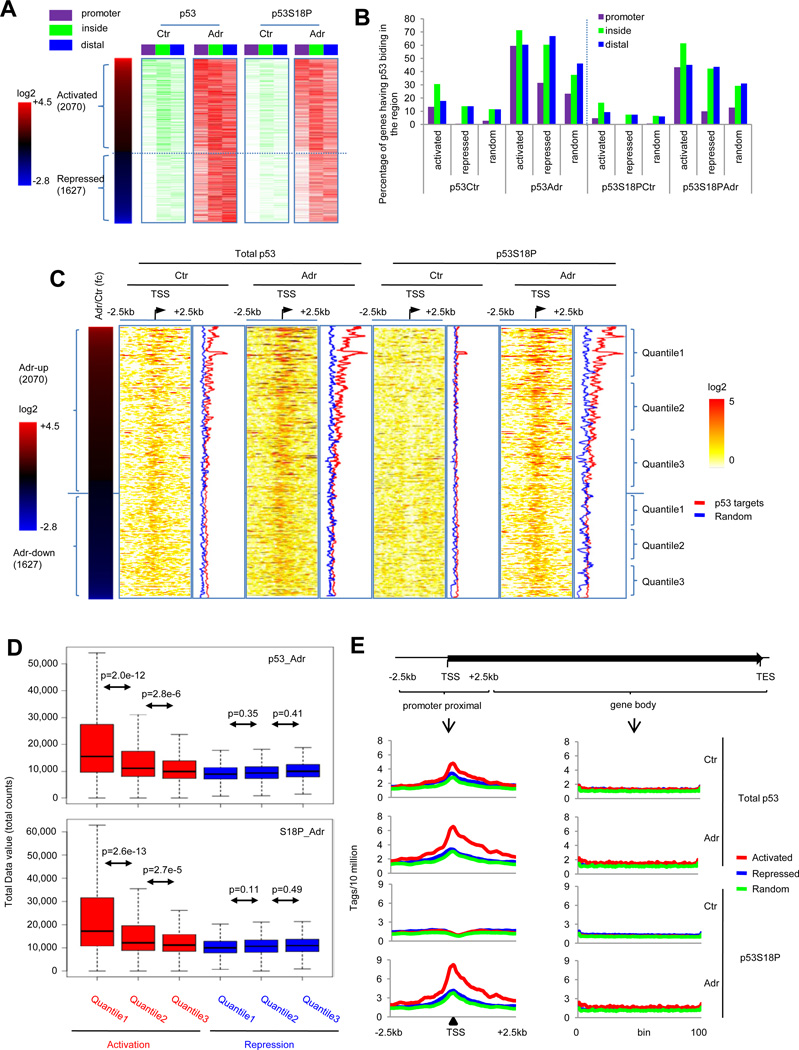
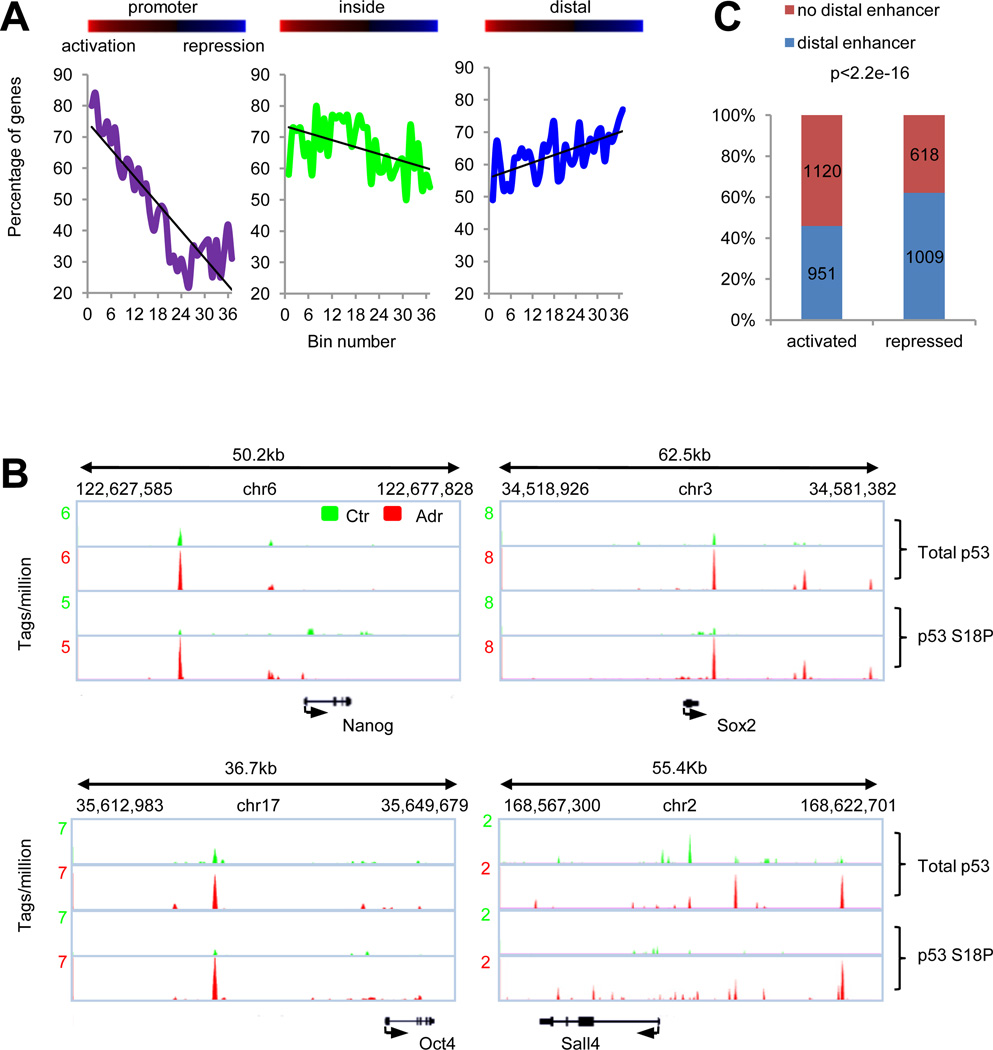
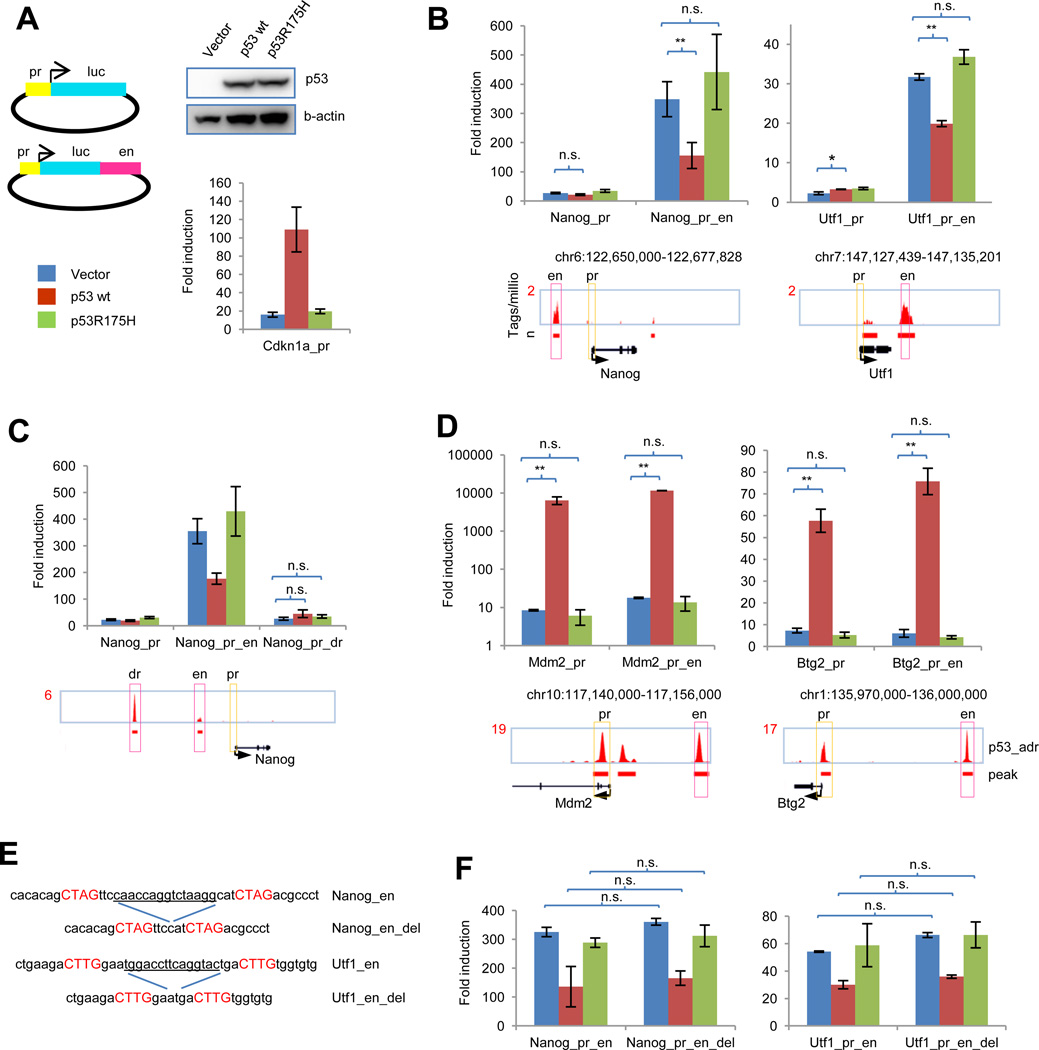
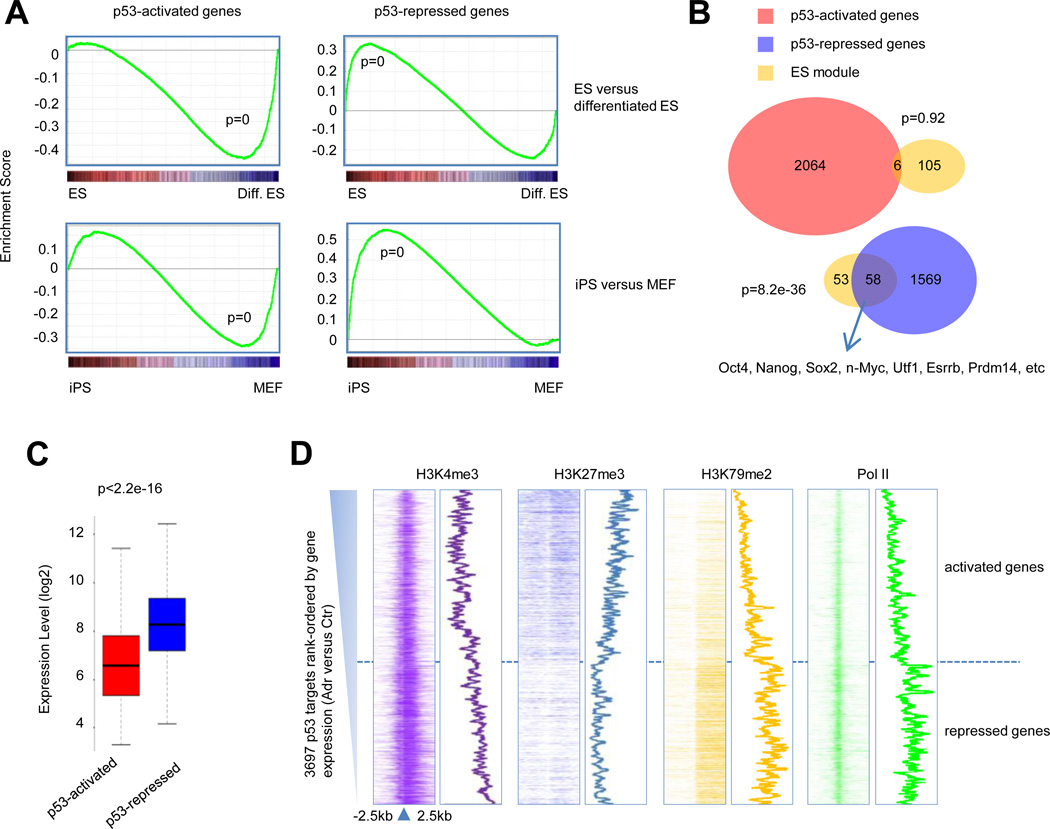
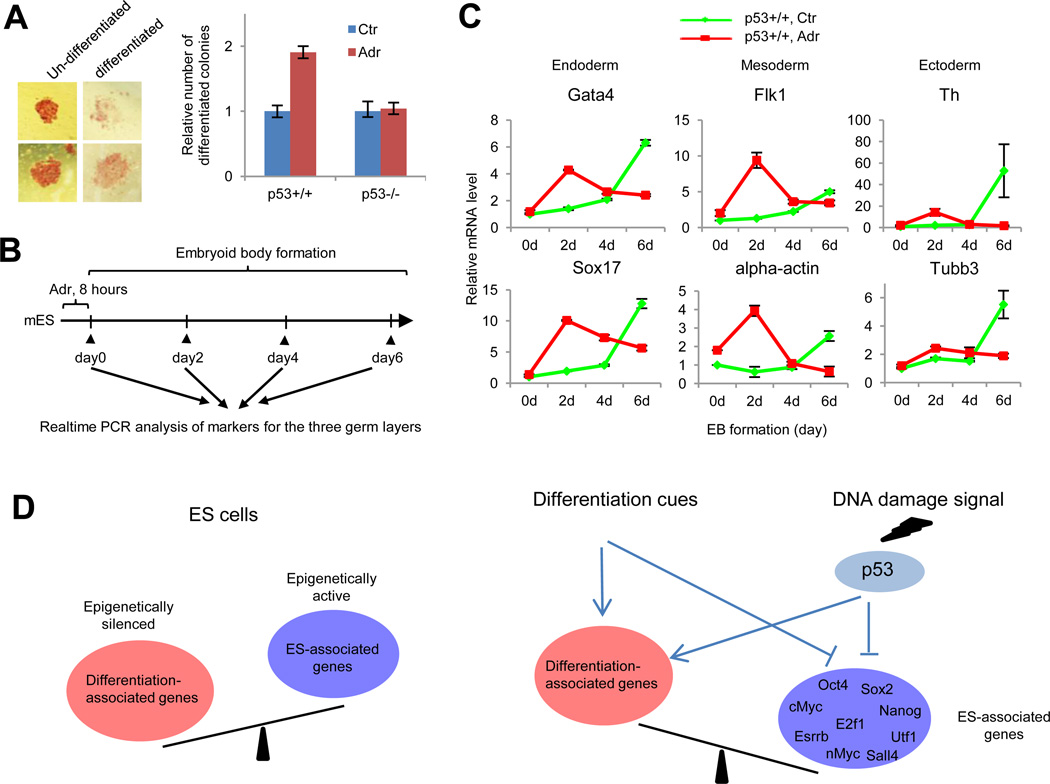
p53 is critical in regulating the differentiation of ES and induced pluripotent stem (iPS) cells. Here, we report a whole-genome study of p53-mediated DNA damage signaling in mouse ES cells. Systems analyses reveal that binding of p53 at the promoter region significantly correlates with gene activation but not with repression. Unexpectedly, we identify a regulatory mode for p53-mediated repression through interfering with distal enhancer activity. Importantly, many ES cell-enriched core transcription factors are p53-repressed genes. Further analyses demonstrate that p53-repressed genes are functionally associated with ES/iPS cell status while p53-activated genes are linked to differentiation. p53-activated genes and -repressed genes also display distinguishable features of expression levels and epigenetic markers. Upon DNA damage, p53 regulates the self-renewal and pluripotency of ES cells. Together, these results support a model where, in response to DNA damage, p53 affects the status of ES cells through activating differentiation-associated genes and repressing ES cell-enriched genes.
Copyright © 2012 Elsevier Inc. All rights reserved.
Conflict of interest statement
The authors declared no conflict of interest.
Figures
Similar articles
-
Genome-wide profiling reveals stimulus-specific functions of p53 during differentiation and DNA damage of human embryonic stem cells.Nucleic Acids Res. 2014 Jan;42(1):205-23. doi: 10.1093/nar/gkt866. Epub 2013 Sep 27. Nucleic Acids Res. 2014. PMID: 24078252 Free PMC article.
-
KAP1 represses differentiation-inducible genes in embryonic stem cells through cooperative binding with PRC1 and derepresses pluripotency-associated genes.Mol Cell Biol. 2014 Jun;34(11):2075-91. doi: 10.1128/MCB.01729-13. Epub 2014 Mar 31. Mol Cell Biol. 2014. PMID: 24687849 Free PMC article.
-
REST maintains self-renewal and pluripotency of embryonic stem cells.Nature. 2008 May 8;453(7192):223-7. doi: 10.1038/nature06863. Epub 2008 Mar 23. Nature. 2008. PMID: 18362916 Free PMC article.
-
Developmental Acquisition of p53 Functions.Genes (Basel). 2021 Oct 23;12(11):1675. doi: 10.3390/genes12111675. Genes (Basel). 2021. PMID: 34828285 Free PMC article. Review.
-
Nanog and transcriptional networks in embryonic stem cell pluripotency.Cell Res. 2007 Jan;17(1):42-9. doi: 10.1038/sj.cr.7310125. Cell Res. 2007. PMID: 17211451 Review.
Cited by
-
Aging of hematopoietic stem cells: DNA damage and mutations?Exp Hematol. 2016 Oct;44(10):895-901. doi: 10.1016/j.exphem.2016.06.253. Epub 2016 Jul 8. Exp Hematol. 2016. PMID: 27402537 Free PMC article. Review.
-
p53-/- synergizes with enhanced NrasG12D signaling to transform megakaryocyte-erythroid progenitors in acute myeloid leukemia.Blood. 2017 Jan 19;129(3):358-370. doi: 10.1182/blood-2016-06-719237. Epub 2016 Nov 4. Blood. 2017. PMID: 27815262 Free PMC article.
-
Overcoming doxorubicin resistance in triple-negative breast cancer using the class I-targeting HDAC inhibitor bocodepsin/OKI-179 to promote apoptosis.Breast Cancer Res. 2024 Mar 1;26(1):35. doi: 10.1186/s13058-024-01799-5. Breast Cancer Res. 2024. PMID: 38429789 Free PMC article.
-
Genome-wide profiling reveals stimulus-specific functions of p53 during differentiation and DNA damage of human embryonic stem cells.Nucleic Acids Res. 2014 Jan;42(1):205-23. doi: 10.1093/nar/gkt866. Epub 2013 Sep 27. Nucleic Acids Res. 2014. PMID: 24078252 Free PMC article.
-
Pin1 is required for sustained B cell proliferation upon oncogenic activation of Myc.Oncotarget. 2016 Apr 19;7(16):21786-98. doi: 10.18632/oncotarget.7846. Oncotarget. 2016. PMID: 26943576 Free PMC article.
References
-
- Blackwood EM, Kadonaga JT. Going the distance: a current view of enhancer action. Science. 1998;281:60–63. - PubMed
-
- Bode AM, Dong Z. Post-translational modification of p53 in tumorigenesis. Nat Rev Cancer. 2004;4:793–805. - PubMed
-
- Chen X, Xu H, Yuan P, Fang F, Huss M, Vega VB, Wong E, Orlov YL, Zhang W, Jiang J, et al. Integration of external signaling pathways with the core transcriptional network in embryonic stem cells. Cell. 2008;133:1106–1117. - PubMed
Publication types
MeSH terms
Substances
Associated data
- Actions
Grants and funding
LinkOut - more resources
Full Text Sources
Other Literature Sources
Molecular Biology Databases
Research Materials
Miscellaneous
