. 2012 Mar 30;45(6):814-25.
doi: 10.1016/j.molcel.2012.01.017. Epub 2012 Mar 1.

R-loop formation is a distinctive characteristic of unmethylated human CpG island promoters

Affiliations

R-loop formation is a distinctive characteristic of unmethylated human CpG island promoters

Paul A Ginno et al. Mol Cell. .

Abstract

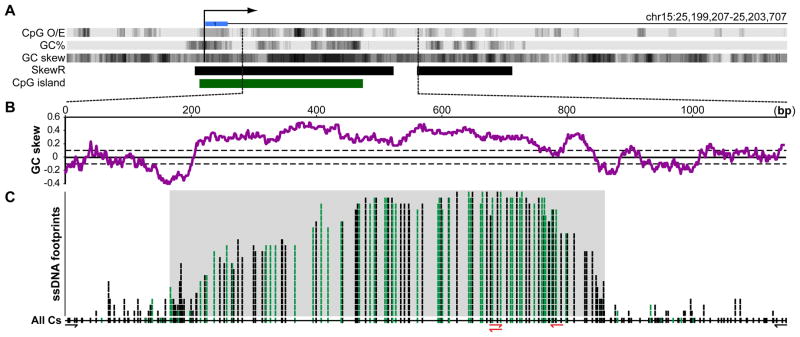
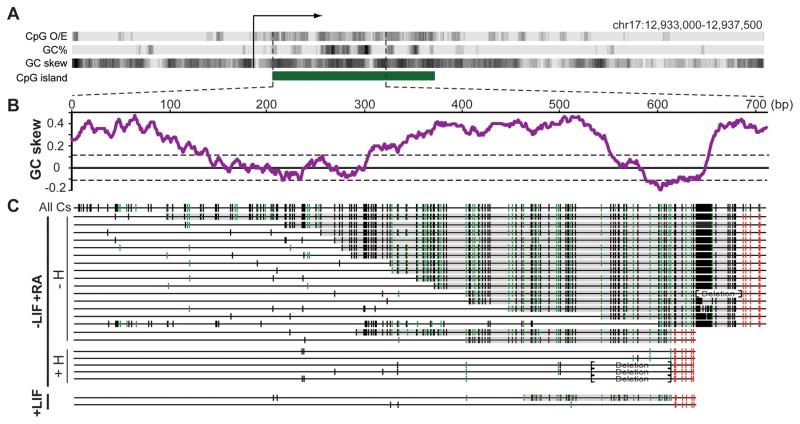
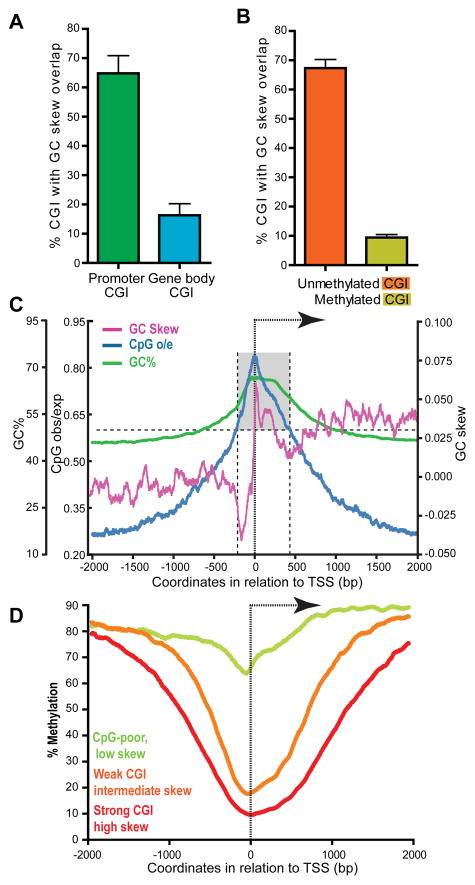
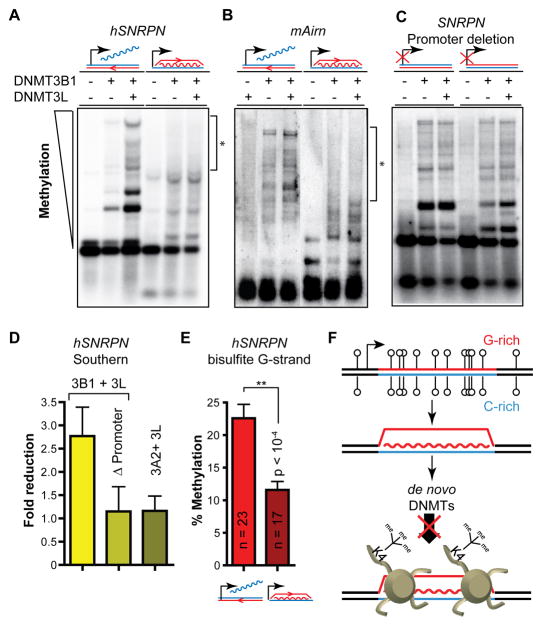
CpG islands (CGIs) function as promoters for approximately 60% of human genes. Most of these elements remain protected from CpG methylation, a prevalent epigenetic modification associated with transcriptional silencing. Here, we report that methylation-resistant CGI promoters are characterized by significant strand asymmetry in the distribution of guanines and cytosines (GC skew) immediately downstream from their transcription start sites. Using innovative genomics methodologies, we show that transcription through regions of GC skew leads to the formation of long R loop structures. Furthermore, we show that GC skew and R loop formation potential is correlated with and predictive of the unmethylated state of CGIs. Finally, we provide evidence that R loop formation protects from DNMT3B1, the primary de novo DNA methyltransferase in early development. Altogether, these results suggest that protection from DNA methylation is a built-in characteristic of the DNA sequence of CGI promoters that is revealed by the cotranscriptional formation of R loop structures.


Figures

Figure 1
Figure 1. Co-oriented positive GC skew is a common property of strong human CGI promoters
A Transcription through regions of GC skew such that a G-rich RNA is generated can lead to R-loop formation (top). In contrast, transcription through the same region such that a C-rich RNA is produced does not lead to R-loop formation (bottom). The G-rich and C-rich strands are color-coded in red and blue, respectively; open lollipops represent unmethylated CpG sites. Note that transcription through regions devoid of GC skew does not give rise to R-loop formation either. B Percent of human genes (RefSeq) showing overlap with GC skew at their 5′ (−500 to +1500 relative to the beginning of the gene) or 3′ (−500 to +1500 relative to the end of the gene) extremities, as determined by the SkewR algorithm. The overlap was calculated for each chromosome and the average and standard deviation for the genome are shown. C Metagene analysis of the 7,820 genes showing positive GC skew co-oriented with transcription. All genes were oriented from left to right (as denoted by the arrow above) and aligned at their TSSs. The graph shows the aggregate GC%, CpG obs/exp ratio, and GC skew values calculated for a 50 nucleotide sliding window. The grey shaded area highlights the portion of the region corresponding to a CpG island (GC%>50% and CpG o/e>0.60).
Figure 2
Figure 2. Formation of genomic R-loops at the endogenous SNRPN CGI promoter
A Schematic representation of the 4.5 kb region surrounding the SNRPN CGI (green). The major transcription start site and first untranslated exon are indicated by a broken arrow and blue box, respectively. The CpG o/e ratio, GC percent, and GC skew are indicated in UCSC Genome Browser dense track format; strong SkewR blocks are indicated by black boxes. The analyzed region is indicated by dashed lines and expanded in the panel below. B The GC skew over the analyzed region is plotted using a 100 nucleotide sliding window. The solid line represents the average genomic GC skew with the standard deviation shown as dotted lines. C This panel depicts the distribution of ssDNA footprints over the analyzed region in a stack format. This was generated from the analysis of 21 individual DNA molecules recovered from H1 ESCs, Ntera2 cells, blood, and brain. Vertical tick marks indicate when a given cytosine on the non-template DNA strand was sequenced as thymine, indicative of a single-stranded conformation. Green tick marks indicate converted cytosines in CpG dinucleotides. The position of all cytosines along the region is indicated on the line at the bottom of the stack (All Cs). The gray shaded area highlights the span of the longest ssDNA footprints. The primers used to generate the sequenced amplicons are indicated at the bottom (red primers corresponding to “converted” primers matching bisulfite-modified DNA).
Figure 3
Figure 3. R-loop formation at the endogenous APOE promoter
All symbols are as described in Figure 2. DNA was recovered from human H1 ESCs and Ntera2 cells and ssDNA footprints determined from 12 independent DNA molecules.
Figure 4
Figure 4. Formation of genomic R-loops at the endogenous mouse Airn CGI promoter
A Schematic description of the 4.5 kb region surrounding the Airn promoter. B GC skew over the analyzed region. C Analysis of R-loop-derived ssDNA footprints. Symbols are as in Figure 2 except each line corresponds to one individual DNA molecule. DNA was analyzed from mESCs differentiated along a neural path by addition of retinoic acid (−LIF+RA, high Airn expression) with (+H) or without (−H) RNase H pre-treatment prior to bisulfite footprinting. Amplicons were also recovered from undifferentiated mESCs (+LIF, little to no Airn expression). Brackets indicate regions that underwent short deletions due to instability of the DNA sequence in E. coli.
Figure 5
Figure 5. Widespread R-loop formation at human promoters
A H1 hESCs were stained with the S9.6 antibody (top left) and counterstained with DAPI (top right). A merge of both channels is shown (bottom left). Nucleolar and mitochondrial staining are indicated by arrows while the boxed inset shows a magnified view of the nucleoplasm. The bottom right panel shows the cellular distribution of the HA-tagged human RNASEH1(ΔMLS) protein (red) upon transfection in HEK293 cells. Cells were counterstained with DAPI (blue). B The aggregate GC skew for all newly identified R-loop forming promoters is graphed in red. All genes were aligned at their TSS and the GC skew computed using a 50 nt sliding window over the −500/+1500 region. The overall GC skew predicted for all 7,820 highly skewed promoters (Figure 1C) is shown in green for comparison. C and D Examples of DRIP-seq data. Each panel shows a schematic description of the region analyzed with TSSs indicated by broken arrows (minor TSSs are shown by dashed lines), exons by blue boxes, CpG islands by green boxes. The SkewR tract shows the position of GC skew blocks with red indicating G-rich blocks and blue C-rich blocks. The RE tract indicates cut sites for the 5 restriction enzymes used to fragment the genome. Below are two tracts representing DRIP-seq read density in the absence (top) or presence (bottom) of Ribonuclease pre-treatment. The red box indicates restriction fragments which coincide with RNase H-sensitive DRIP-seq peaks and therefore harbor R-loop forming regions. The coordinates of each region analyzed (Hg19) are given. The two regions shown here also correspond to DRIVE-seq peaks (data not shown).
Figure 6
Figure 6. R-loop formation potential is predictive of the unmethylated status of CGI promoters
A Percent of promoter CGIs (n=13,636) and gene body CGIs (n=4,598) with GC skew overlap. B Percent of unmethylated (n=1,785) and methylated (n=1,594) CGIs showing GC skew overlap (Methylation data from the hESC dataset from (Straussman et al., 2009)). Unmethylated CGIs showed a methylation score <−0.8 while methylated CGIs had a score > 1.3 in both hESC cell lines). In both panels, the overlap was calculated for each chromosome and the average and standard deviation for the genome are shown. C Metagene analysis of a subset of 4,528 promoter CGIs lacking strong GC skew. Symbols and analysis are as described for Figure 1C. D Aggregate CpG methylation levels around the TSS of genes corresponding respectively to strong CGIs characterized by high GC skew (n=7,820, red), weak CGIs characterized by intermediate GC skew (n=4,526, orange), and “CpG-poor” promoters characterized by little to no skew (n=7,570, green). The DNA methylation data was from (Laurent et al., 2010).
Figure 7
Figure 7. R-loop-mediated protection from DNA methylation
The ability of DNMT3B1 to methylate the SNRPN (A) and Airn (B) CGIs in the presence or absence of the stimulatory factor DNMT3L is shown. CGIs were cloned in episomes in an R-loop forming or non-R-loop forming orientation as graphically indicated above. The episomes were harvested 7 days post-transfection and methylation was analyzed after cleavage by the methyl-sensitive HpaII enzyme, gel electrophoresis and Southern blotting with SNRPN and Airn CGI probes, respectively. Regions showing clear lack of methylation are highlighted by brackets and an asterisk. C is identical to A except the constitutive CMV promoter driving transcription through the SNRPN region was deleted. D For each sample, the graph depicts the fold reduction in methylation comparing the R-loop to the non-R-loop forming orientation, as determined by band densitometry. Values were calculated from three independent experiments and are shown with means and standard error. E The average methylation levels (in %) measured by bisulfite sequencing on the G-rich strand of the SNRPN insert is presented for both orientations. The number of independent molecules sequenced in each case is indicated together with the standard deviation for each sample. F Model for the function of R-loops in the protection against de novo DNA methylation and epigenetic silencing at GC skewed CGIs. See text for details.

Comment in

References

    1. Aerts S, Thijs G, Dabrowski M, Moreau Y, De Moor B. Comprehensive analysis of the base composition around the transcription start site in Metazoa. BMC Genomics. 2004;5:34. - PMC - PubMed
    1. Aguilera A, Gomez-Gonzalez B. Genome instability: a mechanistic view of its causes and consequences. Nat Rev Genet. 2008;9:204–217. - PubMed
    1. Bachman KE, Park BH, Rhee I, Rajagopalan H, Herman JG, Baylin SB, Kinzler KW, Vogelstein B. Histone modifications and silencing prior to DNA methylation of a tumor suppressor gene. Cancer Cell. 2003;3:89–95. - PubMed
    1. Barski A, Cuddapah S, Cui K, Roh TY, Schones DE, Wang Z, Wei G, Chepelev I, Zhao K. High-resolution profiling of histone methylations in the human genome. Cell. 2007;129:823–837. - PubMed
    1. Bird A. DNA methylation patterns and epigenetic memory. Genes Dev. 2002;16:6–21. - PubMed

Publication types