. 2012 May 15;355(1):180-7.
doi: 10.1016/j.mce.2012.02.009. Epub 2012 Feb 22.

Differential placental expression profile of human Growth Hormone/Chorionic Somatomammotropin genes in pregnancies with pre-eclampsia and gestational diabetes mellitus

Affiliations

Differential placental expression profile of human Growth Hormone/Chorionic Somatomammotropin genes in pregnancies with pre-eclampsia and gestational diabetes mellitus

Jaana Männik et al. Mol Cell Endocrinol. .

Abstract

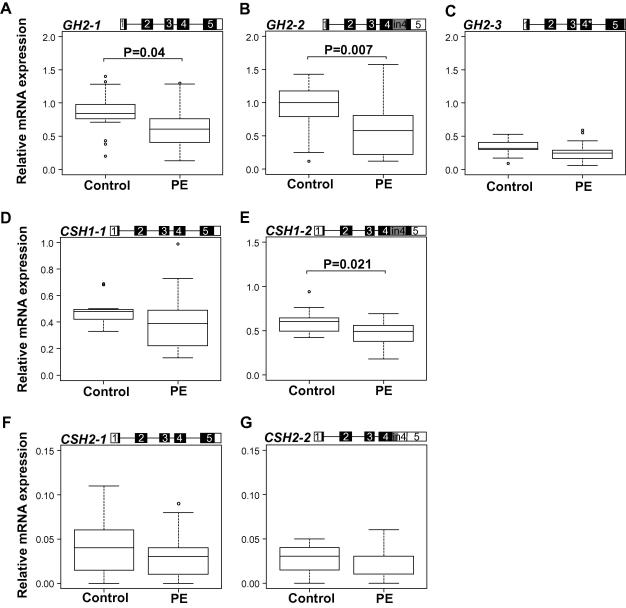
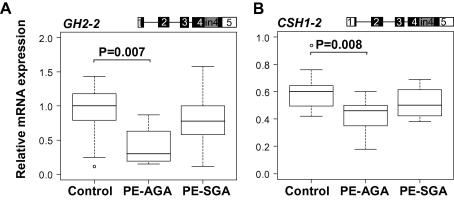
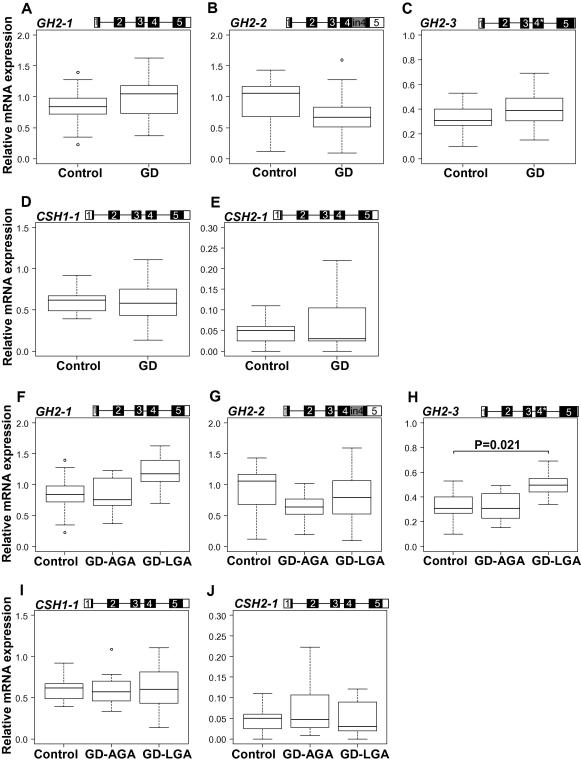
The human GH/CSH cluster consisting of one pituitary-expressed (GH1) and four placenta-expressed loci has been implicated in maternal metabolic adaptation to pregnancy, regulation of intrauterine and postnatal growth. We investigated how the mRNA expression profile of placental GH2, CSH1 and CSH2 genes and their alternative transcripts correlates with maternal pre-eclampsia (PE) and/or gestational diabetes mellitus (GD). The expression of studied genes in PE placentas (n=17) compared to controls (n=17) exhibited a trend for reduced transcript levels. The alternative transcripts retaining intron 4, GH2-2 and CSH1-2 showed significantly reduced expression in PE cases without growth restriction (P=0.007, P=0.008, respectively). In maternal GD (n=23), a tendency of differential expression was detected only for the GH2 gene and in pregnancies with large-for-gestational-age newborns. Our results, together with those reported by others, are consistent with a pleiotropic effect of placental hGH/CSH genes at the maternal-fetal interface relating to the regulation of fetal growth and the risk of affected maternal metabolism.


Figures

Fig. 1
Fig. 1
Comparison of relative expression levels of major alternatively spliced mRNA transcripts of GH2 (A–C), CSH1 (D and E), and CSH2 (F and G) in placentas from uncomplicated pregnancies (control, n = 17) and complicated with pre-eclampsia (PE, n = 17). The corresponding transcript representing the presented data is shown on the top of each panel. Exons are shown as boxes and introns as lines. The coding region is denoted by black/grey-filled area. An asterisk (∗) denotes the 4 bp deletion in exon 4 of GH2-3. Relative expression of each transcript is given as ratio to the reference gene GAPDH. The boxes represent the 25th and 75th percentiles. The median is denoted as the line that bisects the boxes. The whiskers are lines extending from each end of the box covering the extent of the data on 1.5× interquartile range. Circles represent the outlier values. Plotted values are presented without covariate adjustment. Statistical differences between study groups were assessed by ANCOVA using Bonferroni correction. Statistical tests were adjusted for newborns birth-weight, birth length, and abdominal circumference. Bonferroni corrected P-values reflecting significant differences (P < 0.05) are shown.
Fig. 2
Fig. 2
Differential expression of GH2-2 (A) and CSH1-2 (B), two alternative mRNA splice-variants retaining intron 4 sequence, in placental samples from pregnancies with pre-eclampsia (PE) grouped according to the birth-weight of the newborns – PE with the birth of appropriate-for-gestational age newborn (PE-AGA, n = 9) and PE with the birth of small-for-gestational age newborn (PE-SGA, n = 8), compared to control samples (n = 17). The corresponding transcript representing the presented data is shown on the top of panels. Exons are shown as boxes and introns as lines. The coding region is denoted by black/grey-filled area. Relative expression of each transcript is given as ratio to the reference gene GAPDH. The boxes represent the 25th and 75th percentiles. The median is denoted as the line that bisects the boxes. The whiskers are lines extending from each end of the box covering the extent of the data on 1.5× interquartile range. Circles represent the outlier values. Plotted values are presented without covariate adjustment. Statistical differences between study groups were assessed by ANCOVA using Bonferroni correction. Statistical tests were adjusted for gestational age. Bonferroni corrected P-values reflecting significant differences (P < 0.05) are shown.
Fig. 3
Fig. 3
Comparison of relative expression levels of major alternatively spliced mRNA transcripts of GH2, CSH1, and CSH2 in placentas from uncomplicated pregnancies (control, n = 17) and complicated with gestational diabetes mellitus (GD, n = 23) (A-E), as well as with GD pregnancies grouped by the birth-weight of newborns – GD associated with the birth of appropriate-for-gestational age newborn (GD-AGA, n = 12) and GD with birth of large-for-gestational age newborn (GD-LGA, n = 11) (F-J). The corresponding transcript representing the presented data is shown on the top of panel. An asterisk (∗) denotes the 4 bp deletion in exon 4 of GH2-3. Relative expression of each transcript is given as ratio to the reference gene GAPDH. The boxes represent the 25th and 75th percentiles. The median is denoted as the line that bisects the boxes. The whiskers are lines extending from each end of the box covering the extent of the data on 1.5× interquartile range. Circles represent the outlier values. Plotted values are presented without covariate adjustment. Statistical differences between study groups were assessed by ANCOVA using Bonferroni correction. Statistical tests were adjusted for newborn birth-weight, birth length, head and abdominal circumference, placental weight as well as mother’s pre-pregnancy BMI when comparing the control and GD group and for mother’s pre-pregnancy BMI and age after grouping GD samples by the newborn birth-weight. Bonferroni corrected P-values reflecting significant differences (P < 0.05) are shown.

Similar articles

Cited by

References

    1. Barbour L.A., Shao J., Qiao L., Pulawa L.K., Jensen D.R., Bartke A., Garrity M., Draznin B., Friedman J.E. Human placental growth hormone causes severe insulin resistance in transgenic mice. Am. J. Obstet. Gynecol. 2002;186:512–517. - PubMed
    1. Barsh G.S., Seeburg P.H., Gelinas R.E. The human growth hormone gene family: structure and evolution of the chromosomal locus. Nucleic Acids Res. 1983;11:3939–3958. - PMC - PubMed
    1. Boguszewski C.L., Svensson P.A., Jansson T., Clark R., Carlsson L.M., Carlsson B. Cloning of two novel growth hormone transcripts expressed in human placenta. J. Clin. Endocrinol. Metab. 1998;83:2878–2885. - PubMed
    1. Caceres J.F., Kornblihtt A.R. Alternative splicing: multiple control mechanisms and involvement in human disease. Trends Genet. 2002;18:186–193. - PubMed
    1. Chellakooty M., Skibsted L., Skouby S.O., Andersson A.M., Petersen J.H., Main K.M., Skakkebaek N.E., Juul A. Longitudinal study of serum placental GH in 455 normal pregnancies: correlation to gestational age, fetal gender, and weight. J. Clin. Endocrinol. Metab. 2002;87:2729–2734. - PubMed

Publication types

MeSH terms

LinkOut - more resources