Comparative Study
. 2012 Jun;62(7):2430-9.
doi: 10.1016/j.neuropharm.2012.02.017. Epub 2012 Feb 22.

Chronic intermittent ethanol and withdrawal differentially modulate basolateral amygdala AMPA-type glutamate receptor function and trafficking

Affiliations
Comparative Study

Chronic intermittent ethanol and withdrawal differentially modulate basolateral amygdala AMPA-type glutamate receptor function and trafficking

Daniel T Christian et al. Neuropharmacology. 2012 Jun.

Abstract

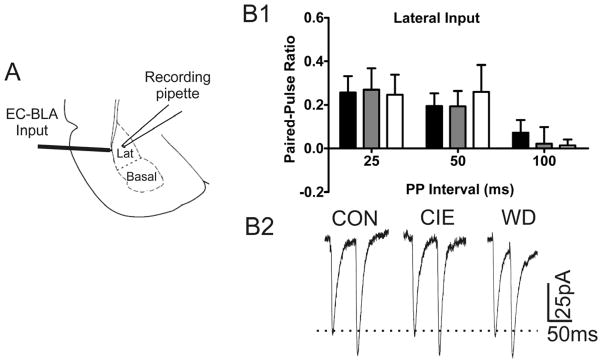
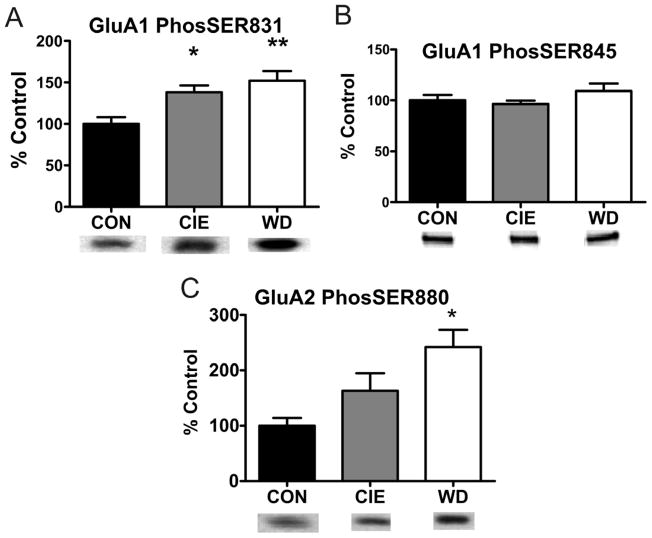
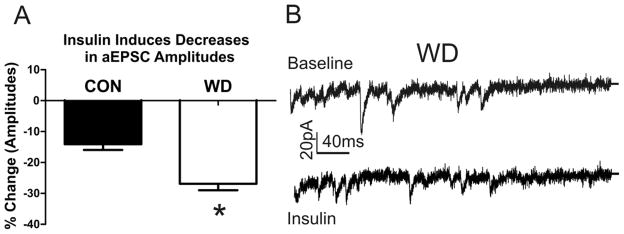
The amygdala plays a critical role in the generation and expression of anxiety-like behaviors including those expressed following withdrawal (WD) from chronic intermittent ethanol (CIE) exposure. In particular, the BLA glutamatergic system controls the expression of both innate and pathological anxiety. Recent data suggests that CIE and WD may functionally alter this system in a manner that closely parallels memory-related phenomena like long-term potentiation (LTP). We therefore specifically dissected CIE/WD-induced changes in glutamatergic signaling using electrophysiological and biochemical approaches with a particular focus on the plasticity-related components of this neurotransmitter system. Our results indicate that cortical glutamatergic inputs arriving at BLA principal via the external capsule undergo predominantly post-synaptic alterations in AMPA receptor function following CIE and WD. Biochemical analysis revealed treatment-dependent changes in AMPA receptor surface expression and subunit phosphorylation that are complemented by changes in total protein levels and/or phosphorylation status of several key, plasticity-associated protein kinases such as calcium/calmodulin-dependent protein kinase II (CaMKII) and protein kinase C (PKC). Together, these data show that CIE- and WD-induced changes in BLA glutamatergic function both functionally and biochemically mimic plasticity-related states. These mechanisms likely contribute to long-term increases in anxiety-like behavior following chronic ethanol exposure.


Conflict of interest statement

DISCLOSURE

The authors declare no conflict of interest.

Figures

Figure 1
Figure 1. Lack of Treatment effect on Paired Pulse Ratios
A) Diagram indicating approximate stimulating electrode and recoding pipette placement in the External Capsule input into the BLA. B) No treatment dependent alterations of paired pulse ratios using evoked EPSCs across a range of inter-stimulus intervals. 25ms; CON [0.2574 ± 0.073, n = 11], CIE [0.2699 ± 0.098, n = 13]; WD [0.2468 ± 0.091 n = 5]; F(2,26) = 0.0124, p > 0.05; 50ms, CON [0.1953 ± 0.057, n = 11]; CIE [0.1938 ± 0.069, n = 13]; WD [0.2601 ± 0.123 n = 6], F(2,27) = 0.1758, p > 0.05; 100ms, CON [0.0726 ± 0.057, n = 10]; CIE [0.0224 ± 0.075, n = 13]; WD [0.0141 ± 0.026 n = 7]; F(2,27) =.2123 p > 0.05. B2) Representative traces of PPR during 50ms inter-event interval showing no alteration in PPR across treatment groups.
Figure 2
Figure 2. Post but not presynaptic alterations following WD as measured by Sr2+ substituted aEPSCs
A1 & A2) A1, Representative traces showing stimulated asynchronous release following Sr2+ substitution (3.0mM) for calcium (2.0mM) that are DNQX sensitive(A2). B) aEPSC event frequency at EC-BLA synapses does not change across treatment conditions (CON, n = 10; CIE n = 13; WD, n = 7). C) aEPSC amplitudes increased during WD compared to CON and CIE conditions (CON, n = 10; CIE, n = 13; WD, n = 7; * = p < 0.01 D) Representative traces showing increased amplitudes during WD compared to control. Dashed lines indicate area included in the analysis.
Figure 3
Figure 3. Treatment dependent increases in AMPAR surface expression
A) WD significantly increases BS3 sensitive surface accessible GluA1 containing AMPAR (n = 4 in all conditions, ** = p < 0.01; 20 μg/lane), with no change in GluA1total protein expression (CON n = 8; CIE n = 8; WD, n = 7; ~110 kD, 10 μg/lane). B) CIE significantly increases BS3 sensitive surface accessible GluA2/3 containing AMPAR surface expression with a further increase in surface accessible receptors during WD (n = 4 in all conditions; * = p > 0.05, ** = p < 0.01; 20 μg protein/lane), with no change in GluA2/3 total protein expression (n = 8 in all conditions; ~108 kD, 10 μg protein/lane). C) No differences in expression of Beta actin (~43 kD) following BS3 treatment (n = 4 in both conditions). D) Representative blots demonstrating BS3 treatment decreasing mobility of BS3 sensitive GluA2/3 AMPAR. *, denotes non-specific band. ←, Denotes location of intracellular portion of GluA2/3 protein.
Figure 4
Figure 4. Site specific increases in AMPAR phosphorylation following CIE and WD exposure
A) Increased phosphorylation at Ser831 on GluA1Rs following CIE and WD (n = 4 in all conditions, * = p < 0.05, ** = p < 0.01; ~110 kD, 20 μg protein/lane) with no change in total protein levels (see Fig. 3). Ser831 is a known CaMKII and PKC phosphorylation site. Increased phosphorylation at this site increases receptor trafficking to the membrane surface. B) No change in PKA dependent phosphorylation of Ser845 on GluA1 containing receptors (n = 4 in all conditions; ~110 kD; 20 μg protein/lane). Demonstrates site specific increases in phosphorylation are not due to global increases in phosphorylation state. C) Increased phosphorylation of Ser880 on GluA2 containing receptors following WD (n = 4 in all conditions, * = p < 0.05; ~108 kD, 20 μg protein/lane) with no change in total protein (see Fig.3). Ser880 phosphorylation can be PKC dependent with increased phosphorylation serving to increase surface trafficking and/or reduce receptor internalization.
Figure 5
Figure 5. Dynamic Increases in CaMKII phosphorylation across CIE and WD
A) Increased Thr286 phosphorylation during CIE compared to both CON and WD conditions (CON n = 7; CIE n = 8; WD n = 7; * = p < 0.05; ~50 kD, 10 μg protein/lane). Increased phosphorylation at Thr286 residues increases kinase activity, in addition to increasing autonomous activity. B) Increased inhibitory Thr305/306 phosphorylation during WD (CON n = 9; CIE n = 8; WD n = 7; * = p < 0.05; ~50 kD, 20μg protein/lane). Phosphorylation at Thr305/306 only occurs following Thr286 phosphorylation and is inhibitory for CaMKII function. This indicates CaMKII activity is down regulated during WD. C) No change in total CaMKII protein expression across treatments (n = 16 in all conditions; ~50 kD; 20 μg/lane). Indicates increases in phosphorylation are not due to increased amount of protein available for phosphorylation, and is related to kinase activity.
Figure 6
Figure 6. Dynamic treatment dependent regulation of isoform specific PKC activity and protein expression
A) Main effect for treatment dependent decrease in PKCα protein expression (n = 4 in all conditions; ~82 kD, 10μg protein/lane). B) Treatment dependent decreases of PKCγ protein expression during both CIE and WD (n = 4 in all conditions, * = p < 0.05, # = p < 0.01; ~78 kD, 10 μg protein/lane). C) Increased Ng Ser36 phosphorylation during CIE (CON, n = 8; CIE, n = 9; WD, n = 7; * = p < 0.05; ~7 kD, 10 μg protein/lane), with no change in total Ng protein (~7 kD; 10 μg protein/lane). D) (CON, n = 8; CIE, n = 9; WD, n = 9). Ng Ser36 phosphorylation is PKC dependent, and indicates that despite decreased PKC protein expression during CIE/WD, the activity of PKC is increased during CIE. Both PKC protein and activity are down regulated during WD.
Figure 7
Figure 7. Insulin application decreases aEPSC amplitudes
A) Data indicates the % decrease of aEPSC amplitudes across both CON and WD treatment groups. Slice application of Insulin significantly decreased CON amplitudes and to a greater extent WD amplitudes (% Baseline, Con, −14.09±1.863%; WD, −26.89±2.103%; Unpaired t-test t=4.555 df = 10 p < 0.01). B) Representative traces showing insulin reduction in aEPSC during WD. Top trace represents baseline responding, while the bottom trace represents responding following insulin (1.0μM) application. Overall, these data demonstrate that regulation of AMPAR is feasible in spite of down regulated kinase activity (see Fig. 5, 6).

Similar articles

Cited by

References

    1. Ahn SM, Choe ES. Alterations in GluR2 AMPA receptor phosphorylation at serine 880 following group I metabotropic glutamate receptor stimulation in the rat dorsal striatum. J Neurosci Res. 2009;88:992–999. - PubMed
    1. Andreasen M, Hablitz JJ. Paired-pulse facilitation in the dentate gyrus: a patch-clamp study in rat hippocampus in vitro. J Neurophysiol. 1994;72:326–336. - PubMed
    1. Appleby VJ, Corrêa SAL, Duckworth JK, Nash JE, Noël J, Fitzjohn SM, Collingridge GL, Molnár E. LTP in hippocampal neurons is associated with a CaMKII-mediated increase in GluA1 surface expression. J Neurochem. 2011;116:530–543. - PubMed
    1. Barria A, Muller D, Derkach V, Griffith LC, Soderling TR. Regulatory phosphorylation of AMPA-type glutamate receptors by CaM-KII during long-term potentiation. Science. 1997;276:2042–2045. - PubMed
    1. Beattie EC, Carroll RC, Yu X, Morishita W, Yasuda H, von Zastrow M, Malenka RC. Regulation of AMPA receptor endocytosis by a signaling mechanism shared with LTD. Nat Neurosci. 2000;3:1291–1300. - PubMed

Publication types

MeSH terms