. 2012 Apr 1;188(7):3247-56.
doi: 10.4049/jimmunol.1103138. Epub 2012 Mar 2.

Spatial alterations between CD4(+) T follicular helper, B, and CD8(+) T cells during simian immunodeficiency virus infection: T/B cell homeostasis, activation, and potential mechanism for viral escape

Affiliations

Spatial alterations between CD4(+) T follicular helper, B, and CD8(+) T cells during simian immunodeficiency virus infection: T/B cell homeostasis, activation, and potential mechanism for viral escape

Jung Joo Hong et al. J Immunol. .

Abstract

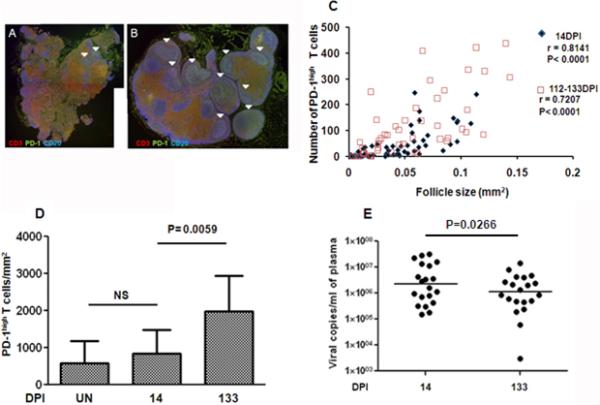
HIV/SIV infections induce chronic immune activation with remodeling of lymphoid architecture and hypergammaglobulinemia, although the mechanisms leading to such symptoms remain to be fully elucidated. Moreover, lymph nodes have been highlighted as a predilection site for SIV escape in vivo. Following 20 rhesus macaques infected with SIVmac239 as they progress from pre-infection to acute and chronic infection, we document for the first time, to our knowledge, the local dynamics of T follicular helper (T(FH)) cells and B cells in situ. Progression of SIV infection was accompanied by increased numbers of well-delineated follicles containing germinal centers (GCs) and T(FH) cells with a progressive increase in the density of programmed death-1 (PD-1) expression in lymph nodes. The rise in PD-1(+) T(FH) cells was followed by a substantial accumulation of Ki67(+) B cells within GCs. However, unlike in blood, major increases in the frequency of CD27(+) memory B cells were observed in lymph nodes, indicating increased turnover of these cells, correlated with increases in total and SIV specific Ab levels. Of importance, compared with T cell zones, GCs seemed to exclude CD8(+) T cells while harboring increasing numbers of CD4(+) T cells, many of which are positive for SIVgag, providing an environment particularly beneficial for virus replication and reservoirs. Our data highlight for the first time, to our knowledge, important spatial interactions of GC cell subsets during SIV infection, the capacity of lymphoid tissues to maintain stable relative levels of circulating B cell subsets, and a potential mechanism for viral reservoirs within GCs during SIV infection.


Figures

Figure 1
Figure 1. Immunohistological profile of PD-1, CD3, CD4, CD8 and CD20-expressing cells within lymph node sections from a representative SIV-naive rhesus macaque
(A) The section was stained with anti-CD20 (blue) to localize lymphoid follicles and (B) stained with anti-PD-1(green), and anti-CD3 (red) to highlight PD-1 expression on CD3 and CD20-expressing cells. (C) shows the staining profile of predominant follicles (few PD-1high expressing cells). (D) shows the staining profile of a minor number of lymphoid follicles with intense PD-1 expressing CD3+ T cells within the germinal center. (C and D) images are enlarged from the white boxes in (B) and collected using a 20X objective. Scale bars = 50 microns. (E to G) represent enlarged images of boxed area shown in (D). Consecutive section of the same lymph node tissue was stained with anti-CD8 and anti-PD-1. (H) shows the profile of CD8 (blue). (I) shows the profile of PD-1 (green). (J) shows the merged images of H and I. Similarly, the next tissue section was stained with anti-CD4 and anti-PD-1. (K) shows the profile of CD4 (blue). (L) shows the profile of PD-1 (green). (M) shows the merged images of K and L. Scale bars = 50 microns.
Figure 2
Figure 2. Immunohistological evaluation of PD-1high expressing CD3+ T cells in lymph node sections of a representative rhesus macaque as a function of time post SIV infection
(A and B) represents the staining profile of CD20 (blue), CD3(red) and PD-1(green) expressing cells within lymph node sections from macaques during acute infection (day 14) (A) and during chronic infection (day 133) (B). White arrow head indicates follicle containing GC and PD-1hi expressing T cells in A and B. Lymph node sections from 10 SIV infected macaques obtained during acute infection (day 14, blue diamond) and during chronic infection (day 133, red open square) were examined for the frequency of PD-1high expressing T cells based on follicle size (mm2) as seen in C. The correlation was assessed by Spearman's rank correlation test. P-values of less than 0.05 were considered statistically significant. (D) represents comparative analysis of PD-1high expressing T cells in 7 un-infected (UN) and the same 10 SIV-infected macaques shown in C. statistically significant. Plasma viral load of the 20 SIV-infected animals used for this study is depicted in E. Statistical analyses were performed using Mann-Whitney ‘U’ test (two-tail P value) and Wilcoxon matched pairs test (two-tail P value). A P-value of less than 0.05 was considered
Figure 3
Figure 3. Flow cytometric analysis of lymph node cells from 7 SIV-naive (UN) and 20 SIV infected rhesus macaques post acute (day 14) and chronic (day 112 to 133) infection
The gating strategy to identify the frequency of CD3+, CD4+ CXCR5+ cells that express PD-1 in representative sample on day 14 and day 112-133 post infection is depicted in A. The isotype controls are also shown here. The mean frequency of PD-1 expressing CD3+ (total) T cells and CD3+ CD4+ T cells that are CXCR5- and CXCR5+ in lymph node cells from 7 SIV-naive (UN) and 20 SIV infected animals post acute (day 14) and chronic (day 112-133) infection is shown in B and C. (D and E) represent MFI values obtained on the same samples. Statistical analyses were performed using Mann-Whitney ‘U’ test (two-tail P value) and Wilcoxon matched pairs test (two-tail P value). Horizontal lines indicate medians. A P-value of less than 0.05 was considered statistically significant.
Figure 4
Figure 4. Identification of CD20+ cells that are predominantly Ki67+ in lymph node sections from SIV infected rhesus macaques during chronic infection
(A) Lymph node section from a representative chronically infected animal was stained with anti-CD3 (red), anti-PD-1 (green) and anti-CD20 (blue). (B) The next consecutive section of the same lymph node was stained with anti-Ki67 and (C to E) represent the profiles seen with anti-PD-1 (C), anti-CD20 (D) and anti-Ki67 (E). (F) represents the merged image of C, D and E. The boxed area in F is shown to highlight the expression of Ki67 by CD20+ cells. Scale bars = 50 microns. The intensity of individual images of single follicles obtained using anti-PD-1 (green) and anti-Ki67 (blue) was measured in lymph node section of SIV-naive (UN) and SIV infected animals post acute & chronic infection. A correlation between Ki67 and PD-1 expression within follicles was determined. Data of individual follicles from the SIV-naive (red square), day 14 SIV-infected (green triangle) and day 133 SIV- infected (blue diamond) animals is shown in G. The correlation was assessed by Spearman's rank correlation test. P-values of less than 0.05 were considered statistically significant.
Figure 5
Figure 5. Increased frequencies of CD27+ memory B cells and PD-1 expressing T cells in the lymph nodes of chronically SIV infected rhesus macaques correlates with hyper gammaglobulinemia
(A) depicts the flow cytometric representative profile of CD21 and CD27 expressing gated population of CD20+ B cells in lymph node, as described previously (24, 25), from SIV- infected macaques during acute and chronic infection. In lymph node (B) and blood (C), the frequencies of CD21+/CD27-, CD21+/CD27+, CD21-/CD27+, and CD21-/CD27- B cells were determined from SIV-naive (UN) and SIV- infected animals during acute (day 14) and chronic (day 112-133) infection. Total serum IgG and IgM levels in 9 rhesus macaques prior to (day 0) and post acute (day 14) and chronic (day 112-113) SIV infection (D and E). (F and G) depict the correlation between plasma levels of IgG & IgM, respectively with frequency of PD-1high follicular T cells. Statistical analyses were performed using Wilcoxon matched pairs test (two-tail P value) and spearman's rank correlation test. P-values of less than 0.05 were considered statistically significant.
Figure 6
Figure 6. CD8+ T cells appear predominantly within the T cell zone (TZ) but not germinal centers (GCs) in lymph node sections from chronically SIV infected animals
Immunohistological profile of p27 expressing cells in lymph node sections from SIV infected animals during chronic infection. A representative profile shows the image at 20X (A) and at 60X for CD4+ cells (B) and P27 expressing cells/CD4+ cells (C). (B and C) images are enlarged from the black box in (A). A representative profile of lymph node sections stained with anti-CD8 and anti-p27 SIVgag is shown at 10x in (D) and at 40x for germinal center (E) and T cell zone (F). The mean frequency of CD3+ CD8+ T cells within follicles of lymph node cells from SIV-naive (UN, n=5) and SIV-infected animals post acute (day 14, n=7) and chronic (day 133, n=7) infection is shown in G. (H) shows a lack of correlation between frequency of follicular CD3+ CD8+ cells and frequency of PD-1+ follicular T cells in the same cohort of SIV-infected animals during acute (day 14, green triangle) and chronic (day 133, blue diamond) infection.
Figure 7
Figure 7. PD-L1 expressing cells are localized within germinal centers of lymph nodes interdigitating with CD4+PD-1hi cells
Immunohistological profile of PD-L1 (red), PD-1 (green) and CD3 (blue) expressing lymph node cells with a representative section from an SIV-naive animal (A) and chronically SIV-infected animal (B). “F” in A and B means follicle. The boxed image in B was magnified and profiles of PD-L1 (C), CD3 and PD-1 (D) and merged image of PD-L1/PD-1/CD3 (E) are shown. Scale bars = 20 microns. A correlation between the intensity of PD-1 and PD-L1 expression by lymph node cells within follicles of representative specimens obtained prior to (red squares, day 0 ), during acute infection (green triangles, day 14) and chronic infection (blue diamonds, day 133) is shown in F. The correlation was assessed by Spearman's rank correlation test. A P-value of less than 0.05 was considered statistically significant.

Similar articles

Cited by

References

    1. Allen CD, Okada T, Cyster JG. Germinal-center organization and cellular dynamics. Immunity. 2007;27:190–202. - PMC - PubMed
    1. Welsh RM, Selin LK, Szomolanyi-Tsuda E. Immunological memory to viral infections. Annu. Rev. Immunol. 2004;22:711–743. - PubMed
    1. Yu D, Vinuesa CG. The elusive identity of T follicular helper cells. Trends Immunol. 2010;31:377–383. - PubMed
    1. Wang C, Hillsamer P, Kim CH. Phenotype, effector function, and tissue localization of PD-1-expressing human follicular helper T cell subsets. BMC Immunol. 2011;12:53. - PMC - PubMed
    1. Vogelzang A, McGuire HM, Yu D, Sprent J, Mackay CR, King C. A fundamental role for interleukin-21 in the generation of T follicular helper cells. Immunity. 2008;29:127–137. - PubMed

Publication types

MeSH terms

Substances