Review
. 2012 Apr;236(2):77-96.
doi: 10.1016/j.mbs.2012.02.003. Epub 2012 Mar 1.

Epidemiological models of Mycobacterium tuberculosis complex infections

Affiliations
Review

Epidemiological models of Mycobacterium tuberculosis complex infections

Cagri Ozcaglar et al. Math Biosci. 2012 Apr.

Abstract

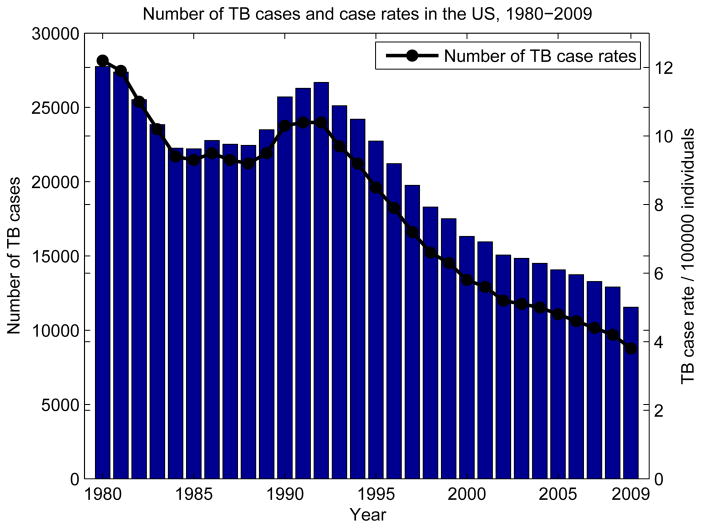
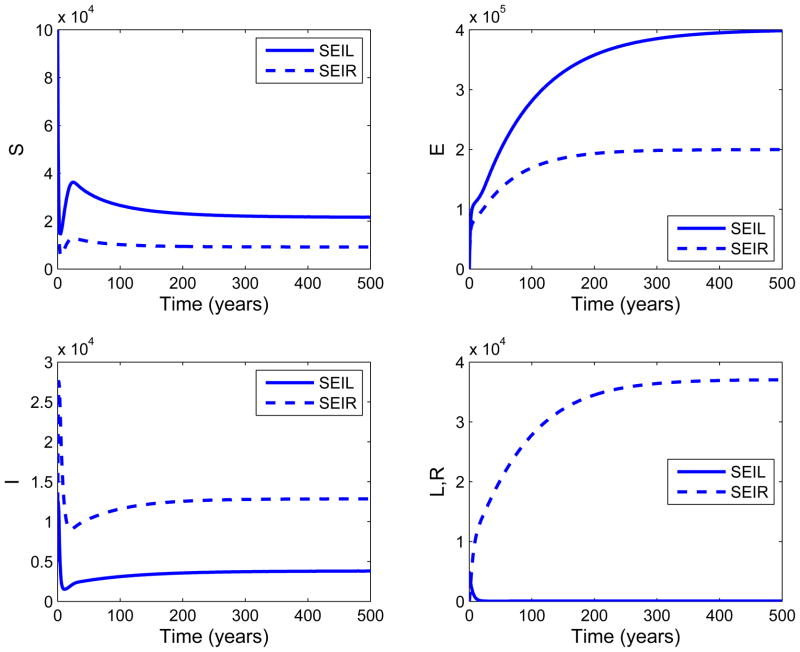
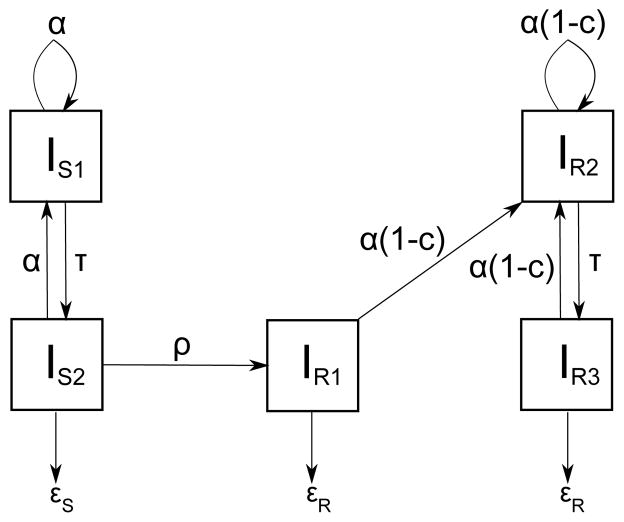
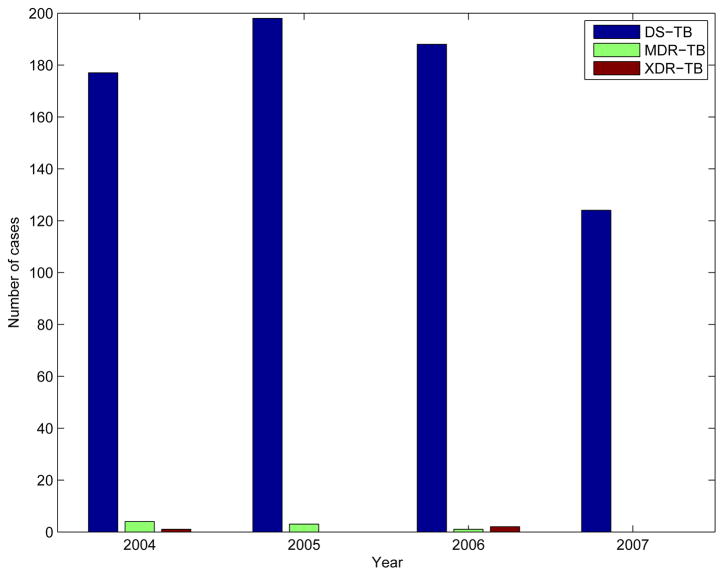
The resurgence of tuberculosis in the 1990s and the emergence of drug-resistant tuberculosis in the first decade of the 21st century increased the importance of epidemiological models for the disease. Due to slow progression of tuberculosis, the transmission dynamics and its long-term effects can often be better observed and predicted using simulations of epidemiological models. This study provides a review of earlier study on modeling different aspects of tuberculosis dynamics. The models simulate tuberculosis transmission dynamics, treatment, drug resistance, control strategies for increasing compliance to treatment, HIV/TB co-infection, and patient groups. The models are based on various mathematical systems, such as systems of ordinary differential equations, simulation models, and Markov Chain Monte Carlo methods. The inferences from the models are justified by case studies and statistical analysis of TB patient datasets.


Figures

Figure 1
Figure 1
Number of cases and case rates per 100000 individuals in the US between 1980–2009 shows a general downward trend with the exception of a sudden rise in 1990s. The plot is generated using data from [5].
Figure 2
Figure 2
SEIR model. Each compartment refers to the set of individuals by disease status: Susceptible, Exposed, Infected, Recovered. Newborn individuals are assumed susceptible. A TB infection can remain latent, or can directly develop into active TB. The latent TB infection can become active through endogenous reactivation or exogenous reinfection. Patients with latent or active TB can recover from TB by treatment, self cure, or quarantine.
Figure 3
Figure 3
SEIR model of Blower et al. in [26] with infectious and noninfectious infected individuals. Class S represents susceptible individuals, E represents latently infected individuals, II and IN represent infectious and non-infectious infected individuals respectively, and R represents recovered individuals.
Figure 4
Figure 4
(a) A numerical simulation of four tuberculosis epidemics using the model in Figure 3. The epidemics were initiated by introducing 1, 10, 100, 1000 infected and infectious individuals respectively at time zero to a fully susceptible population of 100000 (S = 100000, II = 1, 10, 100, 1000). The following parameter values were used: π = 4400, μ = 0.0222, μT = 0.139, v = 0.00256, p = 0.05, f = 0.70, q = 0.85, w = 0.005, c = 0.058, β = 0.00005. The epidemics were observed for 400 years to ensure they reach an endemic equilibrium. The plots show that all four epidemics reach endemic equilibrium in the first 200 years. As the number of infectious individuals introduced to the fully susceptible population decreases, the equilibrium time increases. (b) Number of infected individuals in four epidemics throughout the years. All epidemics have around 1800 infected individuals at equilibrium, independent of the number of infectious individuals introduced to fully susceptible population at t=0.
Figure 5
Figure 5
TB model by Murphy et al. which captures TB dynamics in high-risk and low-risk countries. The compartments of SEI model are subdivided into two: SN, EN, IN and SS, ES, IS, where subscript N stands for neutral and denotes individuals without a susceptible genotype, and subscript S stands for susceptible and denotes individuals with a susceptible genotype. βij represents progression rate of a susceptible individual with genetic susceptibility i to active TB case with genetic susceptibility j, where i, j ∈ {S, N}. The probability pi represents direct progression rate to active TB, and ri represents reactivation rate of latent TB. The population is represented by P = SN + EN + IN + SS + ES + IS.
Figure 6
Figure 6
Transitions showing the interaction of the individuals in the network model of Nyabadzaa et al. Transition (1) represents infection of susceptibles through contact with a suffcient number of infectives, called the primary infection. Transitions (2) and (3) represents TB reinfection through exogenous reinfection and endogenous reactivation. Transition (4) represents recovery from active TB.
Figure 7
Figure 7
Representation of a community as a square lattice on ℤ2. Each site represents a cluster and neighbours of a cluster are the sites which have a common border to the site of the cluster. Inter-cluster transmission rate is λ, and within cluster transmission rate is φ.
Figure 8
Figure 8
a) One-strain model of Blower et al. b) One-strain model of Castillo-Chavez et al. c denotes per-capita contact rate. β and β′ denote the probabilities that susceptible and recovered individuals become infected by one infectious individual per contact per unit time.
Figure 9
Figure 9
a) Two-strain model by Blower et al. b) Two-strain model by Castillo-Chavez et al. β* is the probability that treated individuals become infected by one DR-TB individual per contact per unit time. v′ is the progression rate from latent TB to active TB for DR-TB cases. μT is the mortality rate due to DR-TB. p and q are the proportions of infected individuals who did not complete treatment and became latent DS-TB and DR-TB case respectively.
Figure 10
Figure 10
Comparison of SEIL and SEIR models when R0 > 1. For common parameters of the SEIL and SEIR models, the following values are used: π = 4400, μ = 0.0101, v = 0.005, p = 0.3, β = 0.00005. For other parameters of SEIL and SEIR models, the values in [26] and [60] are used respectively. For the SEIL model, the epidemics were initiated by introducing 5000 infected individuals and 5000 individuals in the class of loss of sight at time zero to a fully susceptible population of 100000 (S=100000, I = 5000, L = 5000). For the SEIR model, the epidemics were initiated by introducing 10000 infected and infectious individuals at time zero to a fully susceptible population of 100000 (S=100000, II = 10000). The infected class I in the SEIR model is referred to as the sum of infected infectious and infected noninfectious classes. The plots show that the time trajectories of S, E, I classes of both models have the same behaviour. On the other hand, the number of individuals in class L decreases over time, while the number of individuals in class R increases. This is due to the fact that, in the SEIL model, an infected individual returns to class E after treatment, whereas it moves to class R in the SEIR model. Therefore, the number of latently infected individuals in class E of the SEIL model is higher than that of the SEIR model.
Figure 11
Figure 11
Relative fitness model of Luciani et al. in [68]. IS1, IS2 are classes for untreated and treated individuals infected with DS-TB and IR1, IR2, IR3 are classes for treated individuals with ADR-TB, untreated individuals with transmitted DR-TB, and treated individuals with transmitted DR-TB respectively. α is the transmission rate, c is the transmission cost due to resistance, ρ is the evolution rate of resistance per individual per unit time, τ is the detection rate per individual per unit time, and εS and εR are the treatment success rates for DS and DR cases.
Figure 12
Figure 12
Drug resistance model by Rodrigues et al. w is the endogenous reactivation rate of latent TB, σ is the immunity factor, τS and τR are treatment rates of active DS-TB and DR-TB cases.
Figure 13
Figure 13
Number of drug-sensitive TB, MDR TB, and XDR TB cases between 2004–2007 based on the NYS-DOH dataset.

Similar articles

Cited by

References

    1. WHO. Report, Global tuberculosis control : epidemiology, strategy, financing. Geneva: World Health Organization; 2009.
    1. Colijn C, Cohen T, Murray M. Mathematical Models of Tuberculosis: accomplishments and future challenges. Proceedings of BIOMAT International Symposium on Mathematical and Computational Biology; World Scientific Publisher; 2006. pp. 123–148.
    1. Aparicio JP, Capurro AF, Castillo-Chavez C. Transmission and dynamics of tuberculosis on generalized households. Journal of Theoretical Biology. 2000;206:327– 341. - PubMed
    1. Snider GL. Tuberculosis then and now: A personal perspective on the last 50 years. Annals of Internal Medicine. 1997;126:237–243. - PubMed
    1. CDC. Reported Tuberculosis in the United States, 2008. Sep, 2009.

Publication types

MeSH terms

Substances