

Pan-colonic field defects are detected by CGH in the colons of UC patients with dysplasia/cancer
- PMID: 22387989
- PMCID: PMC3406733
- DOI: 10.1016/j.canlet.2012.02.031
Pan-colonic field defects are detected by CGH in the colons of UC patients with dysplasia/cancer
Abstract
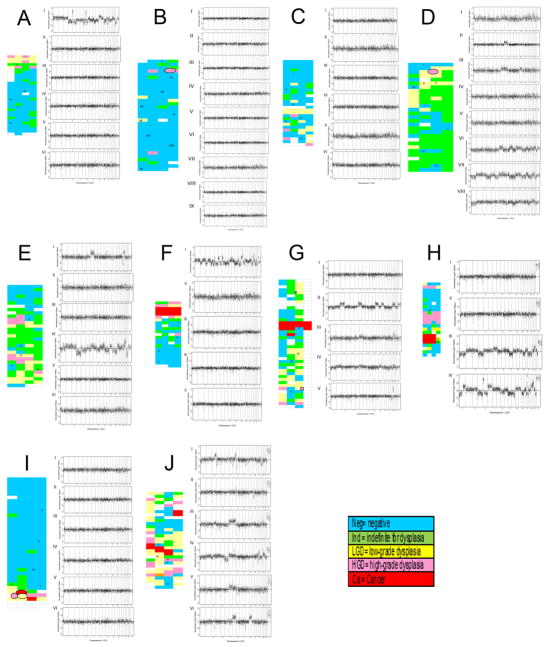
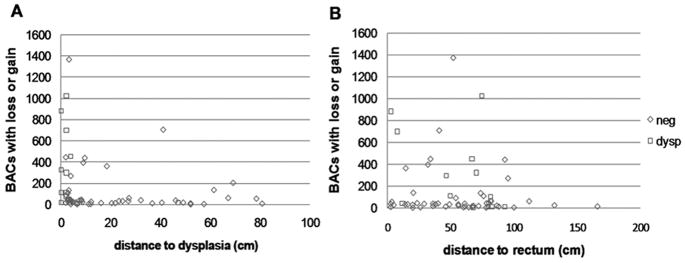
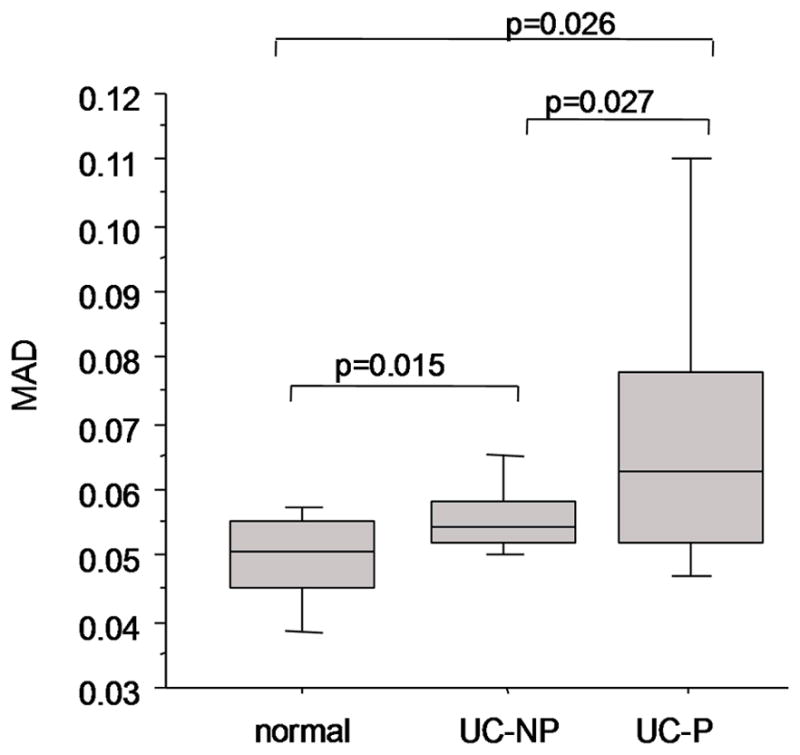
BAC arrays were used to evaluate genomic instability along the colon of patients with ulcerative colitis (UC). Genomic instability increases with disease progression and biopsies more proximal to dysplasia showed increased instability. Pan-colonic field copy number gain or loss involving small (<1Mb) regions were detected in most patients and were particularly apparent in the UC progressor patients who had dysplasia or cancer. Chromosomal copy gains or losses affecting large regions were mainly restricted to dysplastic biopsies. Areas of significant chromosomal losses were detected in the UC progressors on chromosomes 2q36, 3q25, 3p21, 4q34, 4p16.2, 15q22, and 16p13 (p-value⩽0.04). These results extend our understanding of the dynamic nature of pan-colonic genomic instability in this disease.
Copyright © 2012 Elsevier Ireland Ltd. All rights reserved.
Conflict of interest statement
Conflict of Interest Statement
None
Figures

Similar articles
-
Array-based comparative genomic hybridization in ulcerative colitis neoplasia: single non-dysplastic biopsies distinguish progressors from non-progressors.Mod Pathol. 2010 Dec;23(12):1624-33. doi: 10.1038/modpathol.2010.161. Epub 2010 Aug 27. Mod Pathol. 2010. PMID: 20802465 Free PMC article.
-
Characterization of genomic instability in ulcerative colitis neoplasia leads to discovery of putative tumor suppressor regions.Cancer Genet Cytogenet. 2005 Oct 15;162(2):99-106. doi: 10.1016/j.cancergencyto.2005.04.006. Cancer Genet Cytogenet. 2005. PMID: 16213356
-
Chromosomal alterations in ulcerative colitis-related neoplastic progression.Gastroenterology. 1997 Sep;113(3):791-801. doi: 10.1016/s0016-5085(97)70173-2. Gastroenterology. 1997. PMID: 9287970
-
p53 Expression as a Diagnostic Biomarker in Ulcerative Colitis-Associated Cancer.Int J Mol Sci. 2017 Jun 16;18(6):1284. doi: 10.3390/ijms18061284. Int J Mol Sci. 2017. PMID: 28621756 Free PMC article. Review.
-
Development of ulcerative colitis and its associated colorectal neoplasia as a model of the organ-specific chronic inflammation-carcinoma sequence.Pathol Int. 2012 Jun;62(6):368-80. doi: 10.1111/j.1440-1827.2012.02807.x. Epub 2012 Mar 16. Pathol Int. 2012. PMID: 22612505 Review.
Cited by
-
Biomarkers for colitis-associated colorectal cancer.World J Gastroenterol. 2016 Sep 21;22(35):7882-91. doi: 10.3748/wjg.v22.i35.7882. World J Gastroenterol. 2016. PMID: 27672285 Free PMC article. Review.
-
Predicting Colorectal Cancer Occurrence in IBD.Cancers (Basel). 2021 Jun 10;13(12):2908. doi: 10.3390/cancers13122908. Cancers (Basel). 2021. PMID: 34200768 Free PMC article. Review.
-
Targeted next-generation sequencing supports serrated epithelial change as an early precursor to inflammatory bowel disease-associated colorectal neoplasia.Hum Pathol. 2021 Jun;112:9-19. doi: 10.1016/j.humpath.2021.03.002. Epub 2021 Mar 13. Hum Pathol. 2021. PMID: 33727167 Free PMC article.
-
Colorectal Cancer Blood-Based Biomarkers.Gastroenterol Res Pract. 2017;2017:2195361. doi: 10.1155/2017/2195361. Epub 2017 Sep 25. Gastroenterol Res Pract. 2017. PMID: 29147109 Free PMC article. Review.
-
Mucinous and Signet-Ring Cell Colonic Adenocarcinoma in Inflammatory Bowel Disease: A Case-Control Study.Cancers (Basel). 2023 Jul 26;15(15):3803. doi: 10.3390/cancers15153803. Cancers (Basel). 2023. PMID: 37568619 Free PMC article.
References
-
- Brentnall TA, Haggitt RC, Rabinovitch PS, Kimmey MB, Bronner MP, Levine DS, Kowdley KV, Stevens AC, Crispin DA, Emond M, Rubin CE. Risk and natural history of colonic neoplasia in patients with primacy sclerosing cholangitis and ulcerative colitis. Gastroenterology. 1996;110:331–8. - PubMed
-
- Brentnall TA. Molecular underpinnings of cancer in ulcerative colitis. Curr Opin Gastro. 2003;19:64–8. - PubMed
-
- Itzkowitz SH, Harpaz N. Diagnosis and management of dysplasia in patients with inflammatory bowel diseases. Gastro. 2004;126:1634–48. - PubMed
-
- Itzkowitz SH, Present DH. Consensus conference: Colorectal cancer screening and surveillance in inflammatory bowel disease. Inflammatory Bowel Diseases. 2005;11:314–21. - PubMed
-
- Konda A, Duffy MC. Surveillance of patients at increased risk of colon cancer: Inflammatory bowel disease and other conditions. Gastro Clin of North America. 2008;37:191–213. - PubMed
Publication types
MeSH terms
Grants and funding
LinkOut - more resources
Full Text Sources
Medical
