. 2012 Mar 4;44(4):398-405, S1-2.
doi: 10.1038/ng.1110.

Ascorbic acid prevents loss of Dlk1-Dio3 imprinting and facilitates generation of all-iPS cell mice from terminally differentiated B cells

Affiliations

Ascorbic acid prevents loss of Dlk1-Dio3 imprinting and facilitates generation of all-iPS cell mice from terminally differentiated B cells

Matthias Stadtfeld et al. Nat Genet. .

Abstract

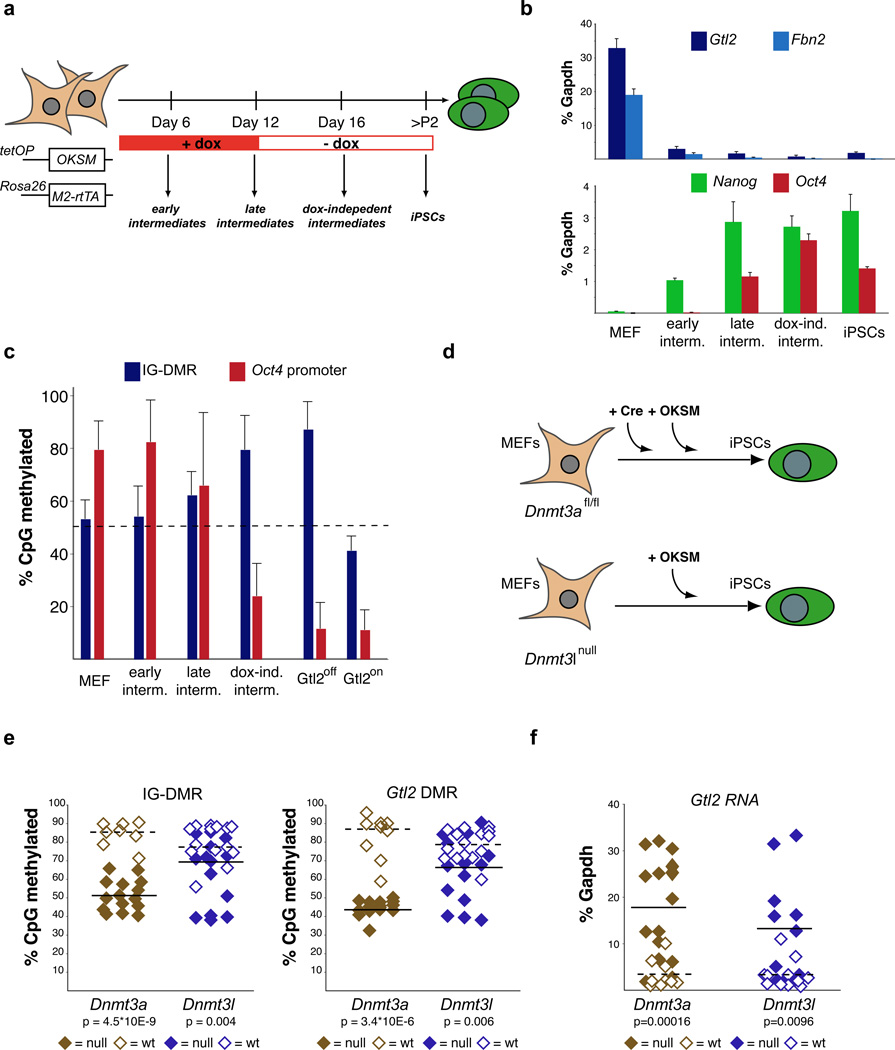
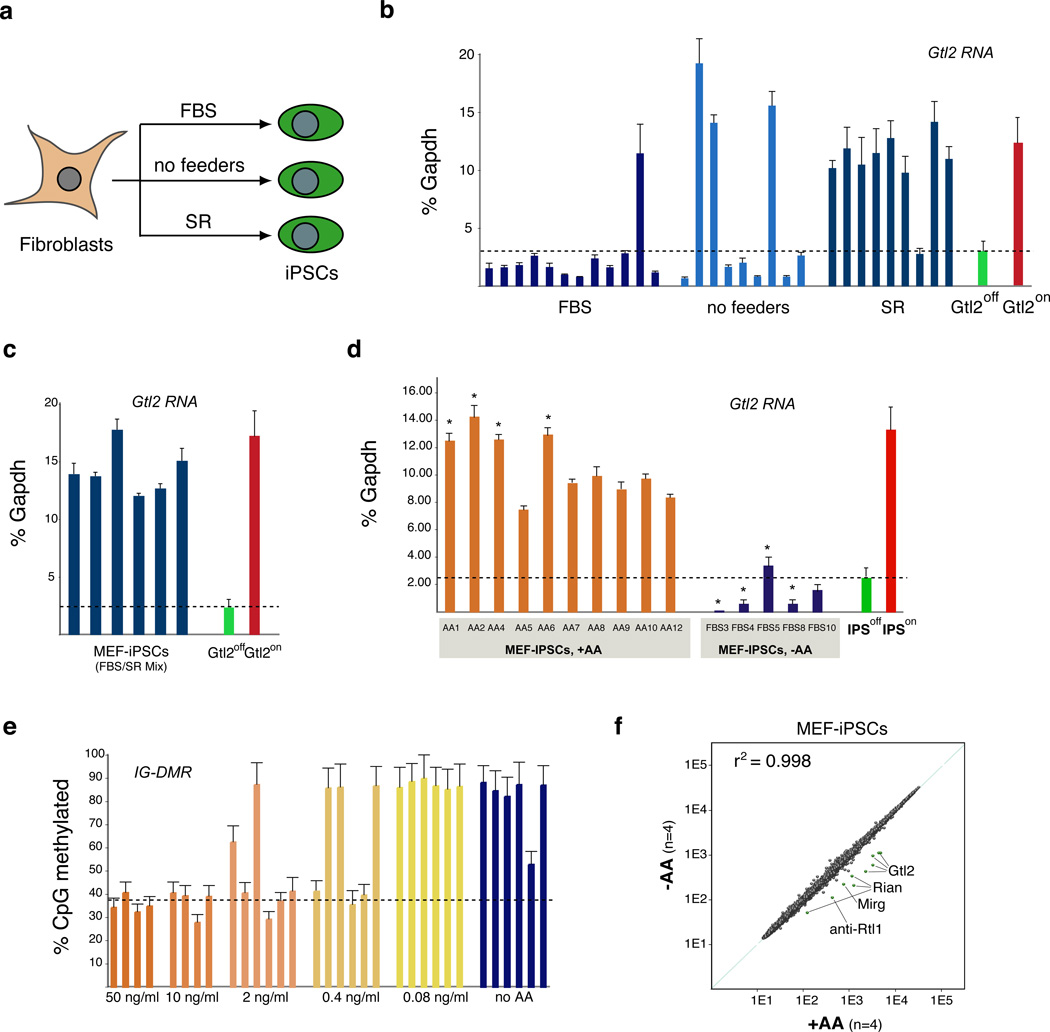
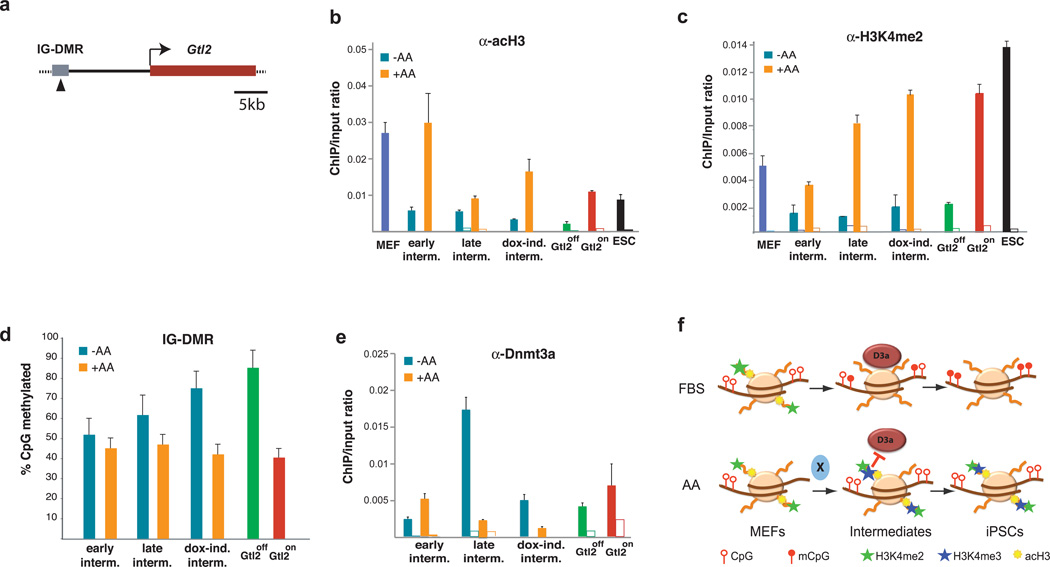
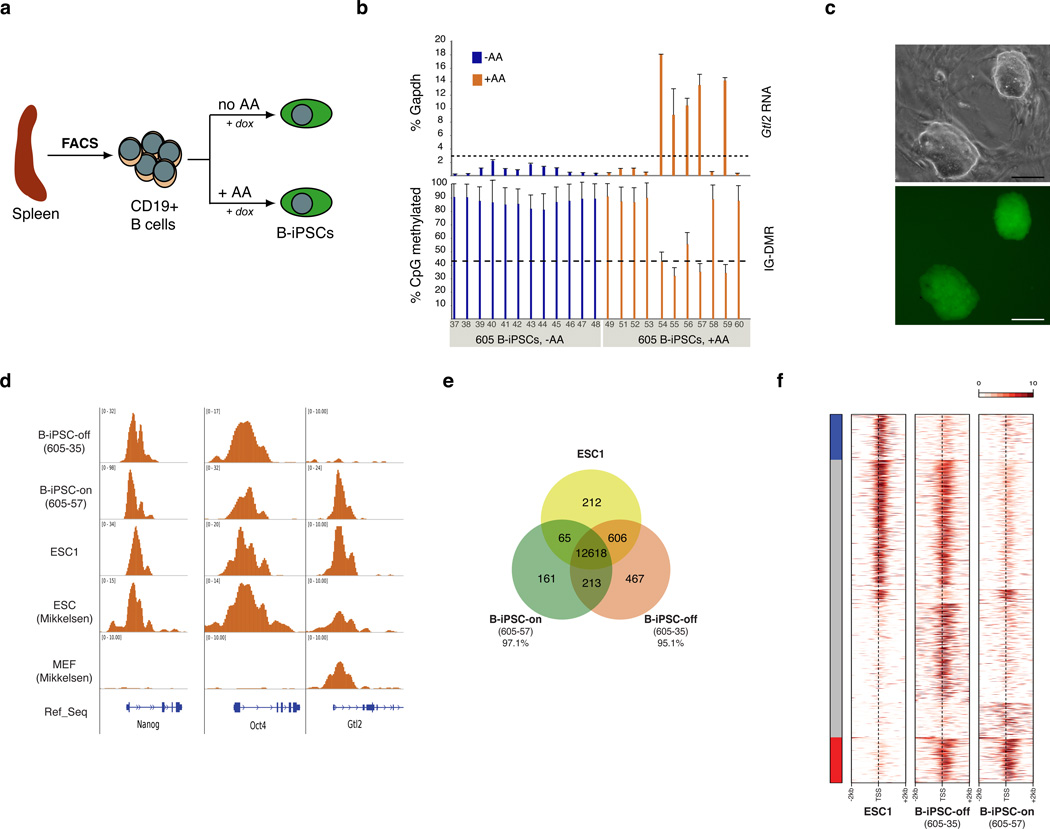
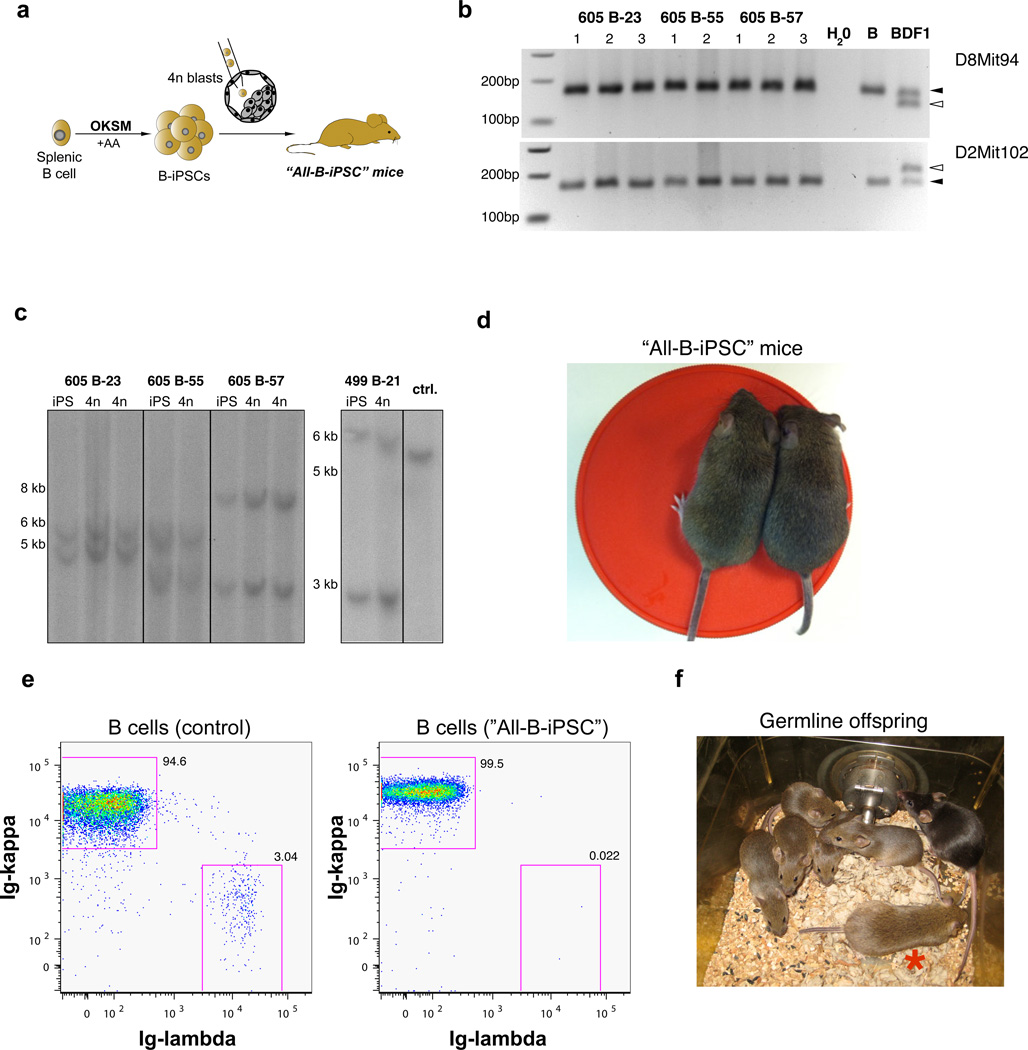
The generation of induced pluripotent stem cells (iPSCs) often results in aberrant epigenetic silencing of the imprinted Dlk1-Dio3 gene cluster, compromising the ability to generate entirely iPSC-derived adult mice ('all-iPSC mice'). Here, we show that reprogramming in the presence of ascorbic acid attenuates hypermethylation of Dlk1-Dio3 by enabling a chromatin configuration that interferes with binding of the de novo DNA methyltransferase Dnmt3a. This approach allowed us to generate all-iPSC mice from mature B cells, which have until now failed to support the development of exclusively iPSC-derived postnatal animals. Our data show that transcription factor-mediated reprogramming can endow a defined, terminally differentiated cell type with a developmental potential equivalent to that of embryonic stem cells. More generally, these findings indicate that culture conditions during cellular reprogramming can strongly influence the epigenetic and biological properties of the resultant iPSCs.


Figures

Figure 1
Figure 1. Gtl2 hypermethylation occurs late during reprogramming and requires Dnmt3a
(a) Strategy for isolation and study of reprogramming intermediates using the doxycycline-inducible Collagen-OKSM system. (b) Q-PCR showing the kinetics of Gtl2 repression during reprogramming in relation to the expression of the fibroblast gene Fibrillin-2 (Fbn2) and the pluripotency genes Nanog and Oct4 (Pou5f1). iPSC values were obtained with two Gtl2off clones. (c) DNA methylation analyses for the IG-DMR and Oct4 promoter in MEFs, reprogramming intermediates and established Gtl2off or Gtl2on iPSC clones. Error bars indicate standard deviations (n=28 for IG-DMR and n=5 for Oct4; number of CpGs analyzed). (d) Strategy for the generation of Dnmt3a- and Dnmt3l-deficient (null) iPSCs. Homozygous Dnmt3l null MEFs were transduced with OKSM virus alone, whereas Dnmt3a conditional null MEFs (floxed, fl/fl) were con-transduced with OKSM virus and a Cre-expressing retrovirus. (e) DNA methylation analyses for the IG-DMR and Gtl2 DMR in Dnmt3a null (n=15), Dnmt3a wild-type (wt) (n=8), Dnmt3l null (n=14) and Dnmt3l wt (n=14) iPSC clones. (f) Gtl2 expression levels, as measured by RT-PCR in Dnmt3a null, Dnmt3l null and corresponding wt iPSC clones (see also Suppl. Figure 1). Dashed lines indicate mean values.
Figure 2
Figure 2. Ascorbic acid treatment prevents Gtl2 silencing
(a) Strategy for the derivation of iPSCs from reprogrammable MEFs in serum-containing media with feeder cells (FBS), serum-containing media without feeder cells (no feeders) and in media containing serum replacement without feeder cells (SR). From the time of doxycycline withdrawal, serum-containing media was used for all cultures. (b) Gtl2 expression levels of iPSC clones generated as outlined in (a). (c) Q-PCR analysis of Gtl2 expression in six independent iPSC clones derived in media containing a 1:1 mix of FBS and SR. (d) Gtl2 expression levels in iPSC clones derived in the presence (+AA) or absence (−AA) of 50 ng/ml ascorbic acid. Upon dox withdrawal, AA was removed from all cultures. Clones marked by asterisks were used for mRNA microarray analysis shown in (f). Error bars in (b)–(d) indicate one standard deviation; n=3. (e) DNA methylation analyses for IG-DMR in iPSC clones generated in medium containing different concentrations of ascorbic acid. Error bars indicate one standard deviation; n=28 (number of CpGs at the IG-DMR). (f) Scatter plot of microarray data comparing iPSC clones derived with ascorbic acid (+AA) or without ascorbic acid (−AA) with differentially expressed genes highlighted in green (two-fold, P<0.05, t-test with Benjamini-Hochberg correction).
Figure 3
Figure 3. Epigenetic changes induced by ascorbic acid during reprogramming
(a) Schematic representation of the Gtl2 locus. Arrowhead indicates region within IG-DMR that was used for ChIP and DNA methylation analyses presented here. (b, c) Relative enrichment of the activation marks, acetylated histone H3 (acH3) and dimethylated H3 lysine 4 (H3K4me2), respectively, at the IG-DMR in MEFs, ESCs and reprogramming intermediates isolated from cultures in the absence (−AA) or presence (+AA) of ascorbic acid. Open columns indicate the background levels of IgG antibody control. (d) DNA methylation analyses for the IG-DMR in reprogramming intermediates. (e) ChIP-PCR analysis detecting Dnmt3a binding at the IG-DMR in reprogramming intermediates. (f) Proposed model of how ascorbic acid prevents aberrant methylation of the maternal Gtl2 allele during reprogramming. Factor X depicts as of yet unidentified activity(ies) that act downstream of ascorbic acid to mediate observed epigenetic changes. Error bars in (a)–(e) indicate one standard deviation; n=3.
Figure 4
Figure 4. Molecular characterization of B-iPSCs generated in the presence of ascorbic acid
(a) Strategy for the generation of B cell-iPSCs (B-iPSCs) from adult mice. (b) RT-PCR analysis of Gtl2 expression (top graph) and DNA methylation analysis of IG-DMR (bottom graph) in individual B-iPSC clones derived in the absence (−AA) or presence (+AA) of ascorbic acid. The number “605” denotes the mouse used for B cell isolation. Error bars indicate one standard deviation; n=3 PCR reactions (upper panel) and n=28 CpGs covered by pyrosequencing analysis, respectively. (c) Representative image of a B-iPSC clone showing typical morphology (top panel) and expression of Oct4-GFP (bottom panel). Scale bars indicate 100 µm. (d) Reads density profile around the transcription start sites (TSSs) of Nanog, Oct4 and Gtl2 for the H3K4me3 modification following genome-wide ChIP-Seq analysis of the ascorbic acid-derived B-iPSC clones 605–35 (Gtl2off) and 605–57 (Gtl2on) and one ESC line (ESC1). All samples were compared to a published data set. Gaussian-smoothed read density is normalized by library size. The vertical axis is adjusted to show the whole peak if higher than 10. (e) Venn diagram representing overlap between H3K4me3-enriched genes between ESC1 and the B-iPSC clones. The indicated percentages show overlap with ESC1. Overlapping areas are not proportional to the actual number of genes. (f) Region map of 4kb window around the TSSs of genes enriched for H3K4me3 in either ESC1 or the individual B-iPSC clones. These are the same genes as reported in Figure 4e excluding the 12,618 genes common to all three groups. The side bar marks genes, which are enriched for H3K4me3 in ESC1 only (blue bar, 212 genes) or in both B-iPSC clones only (red bar, 213 genes). The plot reports Gaussian-smoothed read density enrichment over input samples in log2 scale. For each gene, the maximum enrichment across all of the samples is used to compute a scaling factor so that maximum value is equal to 10.
Figure 5
Figure 5. Functional characterization of B-iPSC clones generated in the presence of ascorbic acid
(a) Strategy for the derivation of all-B-iPSC mice by tetraploid embryo complementation. (b) Confirmation of origin of all-B-iPSC mice by PCR for strain-specific polymorphisms. Two different Simple Sequence Polymorphism (SSLP) markers were tested using genomic DNA isolated from tissues of all-BiPSC mice and the parental B cells. Genomic DNA from BDF1 mice served as control for the presence of host blastocyst-derived cells. Triangles indicate the position of strain-specific bands; open triangle = DBA/2 (host blastocyst-specific) and black triangle = C57BL/6 (present in both host blastocysts, parental cells and iPSCs). (c) Southern blot analyses of immunoglobulin heavy chain (IgH) locus rearrangement using genomic DNA isolated from different all-B-iPSC mice and the corresponding four parental B-iPSC clones. DNA isolated from a MEF-iPSC clone was used as a control to visualize unrearranged IgH germline configuration (single band). (d) Image of two agouti all-B-iPSC mice at 5 weeks of age. (e) FACS analysis of B cells isolated from a control (con) mouse and one all-B-iPSC mouse shows expression of only one type of immunoglobulin (Ig) light chain (Ig-kappa or Ig-lambda), thus confirming monoclonality. (f) Image of a three-month-old all-B-iPSC mouse (indicated by red asterisk) and its germline offspring (5 agouti mice).

Comment in

References

    1. Takahashi K, Yamanaka S. Induction of pluripotent stem cells from mouse embryonic and adult fibroblast cultures by defined factors. Cell. 2006;126:663–676. - PubMed
    1. Stadtfeld M, Hochedlinger K. Induced pluripotency: history, mechanisms, and applications. Genes Dev. 24:2239–2263. - PMC - PubMed
    1. Wu SM, Hochedlinger K. Harnessing the potential of induced pluripotent stem cells for regenerative medicine. Nat Cell Biol. 13:497–505. - PMC - PubMed
    1. da Rocha ST, Edwards CA, Ito M, Ogata T, Ferguson-Smith AC. Genomic imprinting at the mammalian Dlk1-Dio3 domain. Trends Genet. 2008;24:306–316. - PubMed
    1. Stadtfeld M, et al. Aberrant silencing of imprinted genes on chromosome 12qF1 in mouse induced pluripotent stem cells. Nature - PMC - PubMed

Publication types

MeSH terms

Associated data