. 2012 Sep;19(9):1435-45.
doi: 10.1038/cdd.2012.17. Epub 2012 Mar 2.

The Apaf-1-binding protein Aven is cleaved by Cathepsin D to unleash its anti-apoptotic potential

Affiliations

The Apaf-1-binding protein Aven is cleaved by Cathepsin D to unleash its anti-apoptotic potential

I M Melzer et al. Cell Death Differ. 2012 Sep.

Abstract

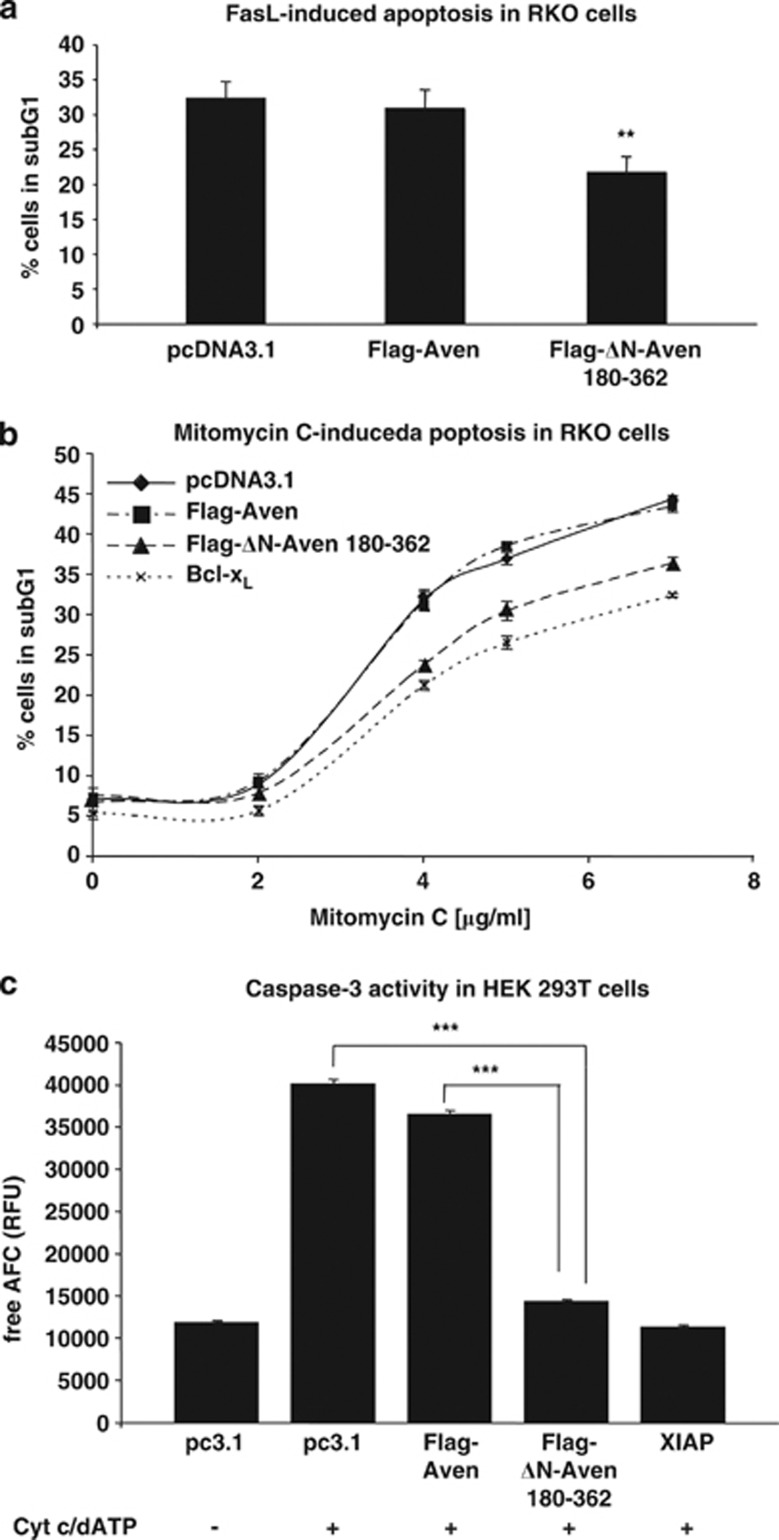
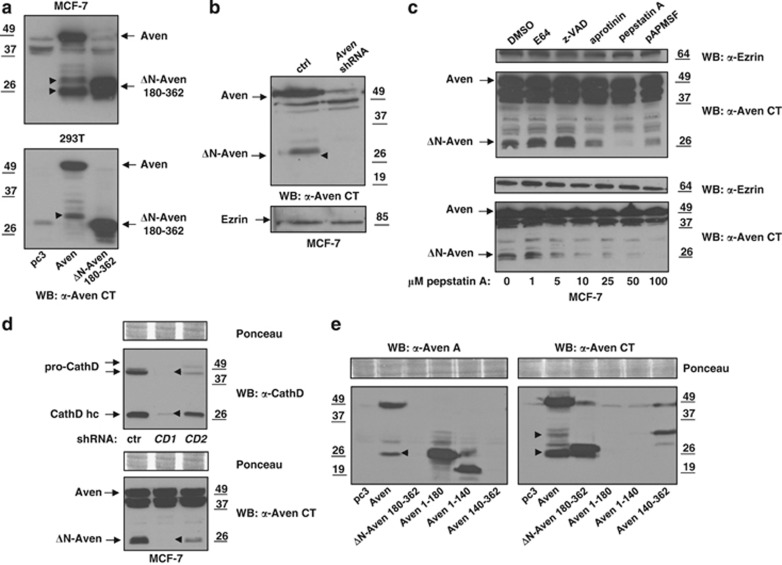
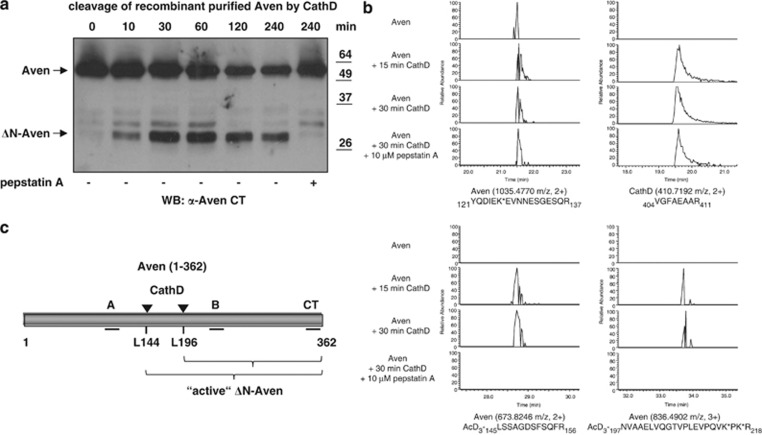
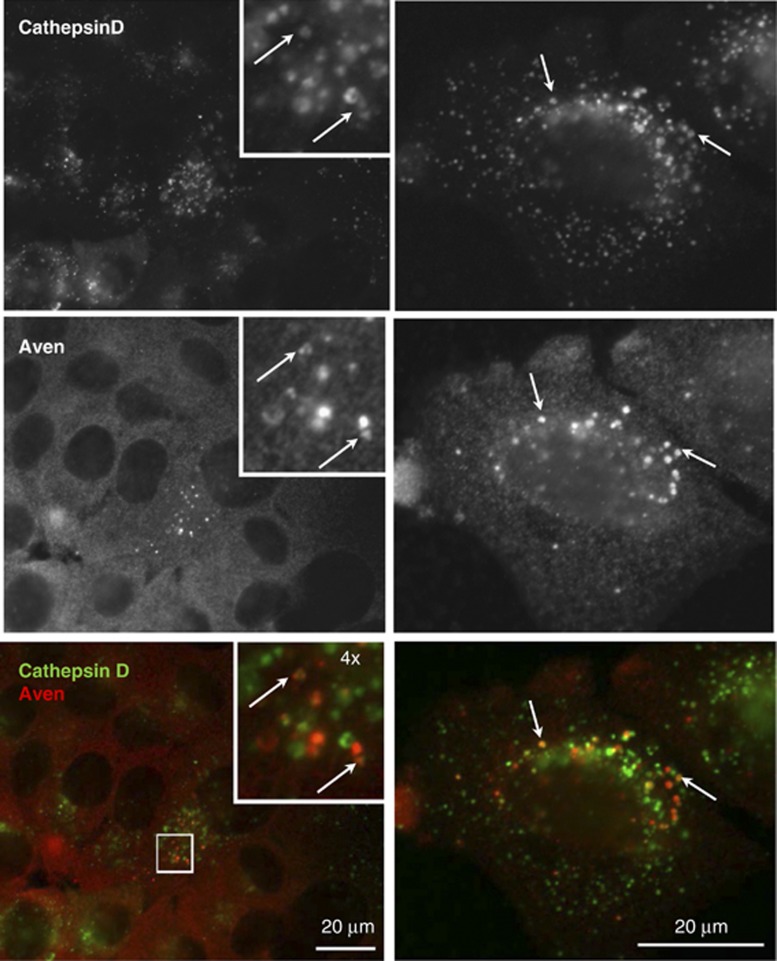
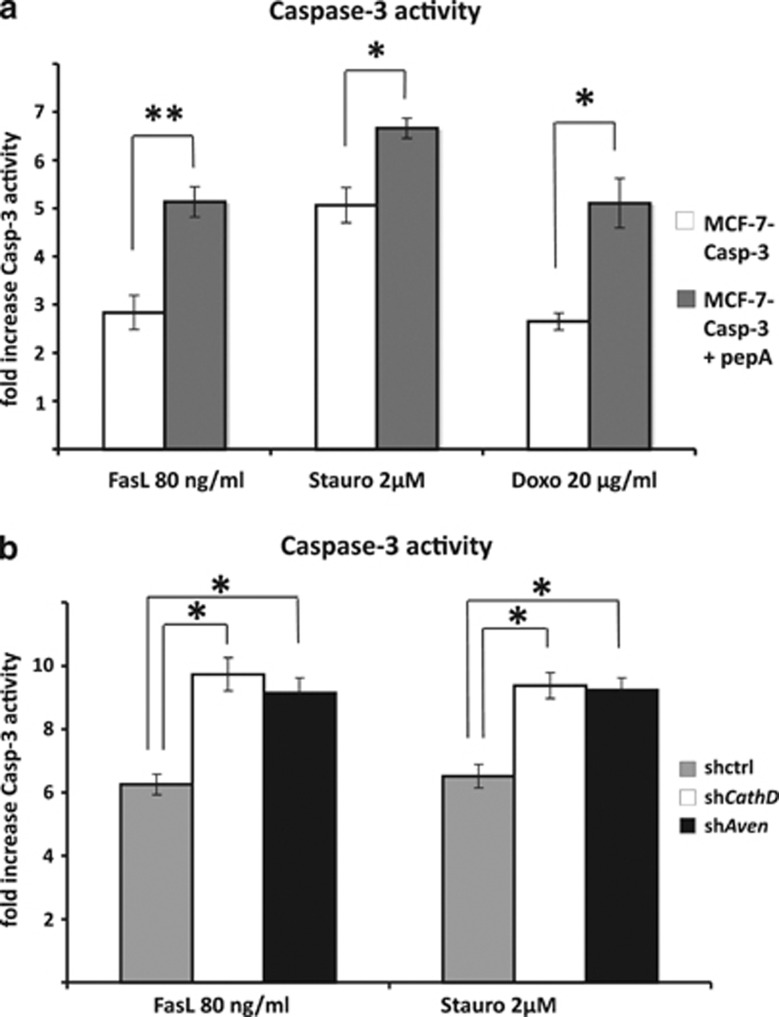
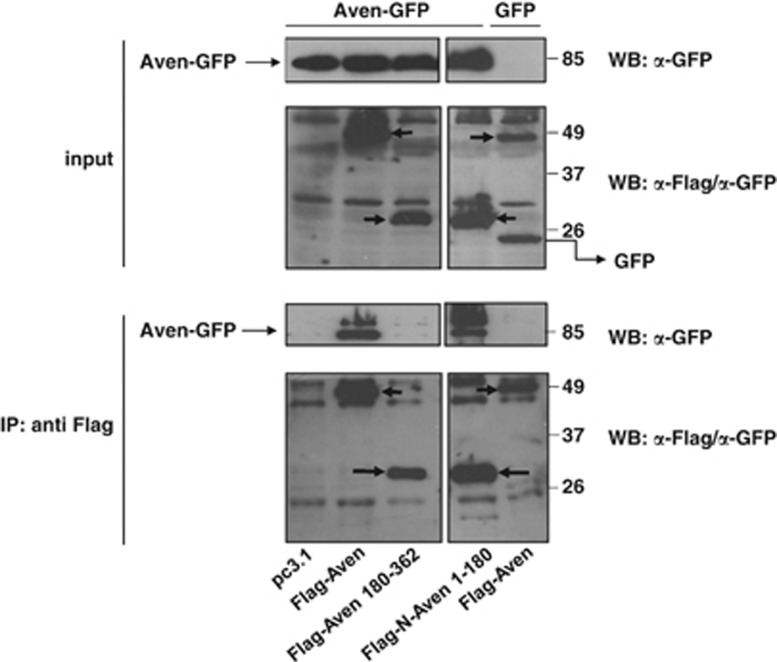
The anti-apoptotic molecule Aven was originally identified in a yeast two-hybrid screen for Bcl-x(L)-interacting proteins and has also been found to bind Apaf-1, thereby interfering with Apaf-1 self-association during apoptosome assembly. Aven is expressed in a wide variety of adult tissues and cell lines, and there is increasing evidence that its overexpression correlates with tumorigenesis, particularly in acute leukemias. The mechanism by which the anti-apoptotic activity of Aven is regulated remains poorly understood. Here we shed light on this issue by demonstrating that proteolytic removal of an inhibitory N-terminal Aven domain is necessary to activate the anti-apoptotic potential of the molecule. Furthermore, we identify Cathepsin D (CathD) as the protease responsible for Aven cleavage. On the basis of our results, we propose a model of Aven activation by which its N-terminal inhibitory domain is removed by CathD-mediated proteolysis, thereby unleashing its cytoprotective function.


Figures

Figure 1
Figure 1
ΔN-Aven 180–362 suppresses mitochondrial apoptosis while full-length Aven fails to prevent cell death. (a) RKO cells transiently transfected with pcDNA3.1 (empty vector), full-length Flag-Aven or Flag-ΔN-Aven 180–362 were treated for 16 h with FasL (20 ng/ml). Levels of apoptosis in treated cells were quantified as the percentage of cells in the subG1 phase in three independent flow cytometry experiments. The Student's t-test was used to assess the statistical significance of the Flag-Aven and Flag-ΔN-Aven results (P≤0.01). (b) RKO cells were transiently transfected with empty vector pcDNA3.1 (negative control), full-length Flag-Aven, Flag-ΔN-Aven 180–362 or Bcl-xL (positive control). Cells were then treated with various concentrations of mitomycin C. After 16 h, apoptosis was quantified by flow cytometry. The mean values of three independent experiments (each in duplicate) are shown. A one-way ANOVA test was performed with a LSD/Bonferroni post-hoc analysis to test for significant differences between the two constructs (at varying concentrations of mitomycin C). The variations between the Flag-Aven, Flag-ΔN-Aven 180–362, and Bcl-xL results are highly significant at 4.5 and 7 μg/ml mitomycin C (P≤0.001). (c) Caspase-3 activity was measured in extracts derived from the HEK 293T cells previously transfected with empty vector pcDNA3.1 (pc3.1), full-length Flag-Aven, Flag-ΔN-Aven 180–362, or XIAP (Caspase-3 inhibitor). Cell lysates were incubated in the presence (+) or absence (−) of Cyt c and dATP to induce apoptosome formation. Caspase-3 activity was then quantified fluorometrically upon cleavage of the added DEVD-AFC substrate. The mean values of eight independent experiments (each performed in triplicate) are shown. The mean Caspase-3 activity in lysates containing Flag-ΔN-Aven 180–362 was significantly decreased compared to lysates of cells transfected with pcDNA3.1 or Flag-Aven (P≤0.001, One-way ANOVA with Games–Howell post-hoc analysis). The bars in a–c represent standard errors with ** and *** indicating P≤0.01 and P≤0.001, respectively
Figure 2
Figure 2
CathD removes the inhibitory Aven N-terminus. (a) MCF-7 and HEK 293T cells were transfected with pcDNA3.1 (pc3.1), pcDNA3.1 full-length Flag-Aven (Aven) or pcDNA3.1 ΔN-Aven 180–362, and western blot analysis was performed using an antibody directed against the Aven CT(anti-Aven CT, ProSci). In both cell lines transfected with full-length Aven, a smaller ΔN-Aven fragment of approximately 30 kDa was detected (labeled with arrowheads). In MCF-7 cells, this band appears as a doublet. (b) MCF7 cells were transduced with either pLKO.1 puro containing a non-target control shRNA (control; ctrl) or pLKO.1 puro Aven shRNA (Aven shRNA). After puromycin selection of a stable cell pool, cell lysates were prepared for an immunoblot assay with the anti-Aven CT antibody. An endogenous 30-kDa ΔN-Aven fragment (visible in the control shRNA-transduced cells, labeled with an arrowhead) disappeared together with the full-length protein upon Aven knockdown. Equal protein loading was demonstrated by incubation of the membrane with anti-Ezrin antibody. (c) Pepstatin A treatment prevents formation of ΔN-Aven. Upper panel: MCF-7 cells were treated with the following protease inhibitors for 24 h: E64 (50 μM; inhibits cysteine proteases), z-VAD-fmk (20 μM; caspases), aprotinin (20 μg/ml; serine proteases), pepstatin A (50 μM; aspartic proteases), pAPMSF (100 μM; serine and cysteine proteases) and DMSO (20 μl; solvent control). The cells were harvested for preparation of protein lysates, and endogenous full-length and ΔN-Aven were detected by immunoblotting with an anti-Aven CT antibody. Lower panel: MCF-7 cells were treated for 24 h with various pepstatin A concentrations. (d) CathD knockdown abrogates formation of ΔN-Aven. MCF-7 cells were transduced with either non-target control shRNA (control; ctrl) or one of two different CathD-specific shRNAs (CD1, CD2). After puromycin selection of stable cell pools, immunoblot analysis was performed with anti-Cathepsin D and anti-Aven CT antibodies. Equal protein loading was demonstrated using Ponceau S staining of the membranes. The arrowheads indicate complete lack of CathD expression and the absence of endogenous ΔN-Aven in CD1-transduced cells. CathD hc: CathD heavy chain. (e) HEK 293T cells were transfected with pcDNA3.1 (pc3.1), pcDNA3.1 full-length Flag-Aven (Aven), pcDNA3.1 ΔN-Aven 180–362, pcDNA3.1 Aven 1–180, pcDNA3.1 Aven 1–140 or pcDNA3.1 Aven 140–362. Western blot analysis was performed using the Aven A antiserum from Chau et al., which recognizes aa 98–112, thereby detecting N-terminal Aven fragments, and an antibody directed against the Aven CT (anti-Aven CT, ProSci). Arrowheads indicate the N-terminal Aven fragment (anti-aven A, left panel) and the C-terminal ΔN-Aven fragment (anti-Aven CT, right panel) generated by CathD cleavage of overexpressed full length Aven. As expected from the binding sites, the anti-Aven A antiserum was not able to detect ΔN-Aven 180–362 and Aven 140–362 (left panel), whereas the anti-Aven CT antiserum did not recognize Aven 1–180 or Aven 1–140 (right panel)
Figure 3
Figure 3
Identification of CathD cleavage sites in the Aven protein by mass spectrometry. (a) Full-length Aven purified from HEK 293T cells was incubated with recombinant human CathD at pH 6.5. Time-dependent direct cleavage of Aven by CathD was evaluated by western blot analysis using the anti-Aven CT antiserum. Incubation for two hours without recombinant CathD failed to result in cleavage of the full-length Aven protein (data not shown). (b) Purified Aven protein was incubated with recombinant CathD, and newly formed alpha-N-terminal amines (and epsilon amines of lysine side-chains) were modified using trideutero-acetylation. Following trypsin digestion, LC-MS/MS analysis and peptide identification, peptides with trideutero-acetylated alpha-N-termini were considered as proteolysis-reporter peptides indicative of CathD processing. Extracted ion chromatograms (XIC) are shown for selected Aven and CathD peptides. Internal tryptic peptides with primary alpha-N-termini demonstrated the presence of both proteins in each sample (two upper panels). Two peptides with trideutero-acetylated N-termini reported protease cleavage at two positions in the Aven sequence when CathD was present without pepstatin A (two lower panels). Trideutero-acetylated lysine side-chains are indicated with an asterisk (*), and maximum Mascot score/threshold values were 139/38 (YQDIEK*EVNNESGESQR), 66/40 (VGFAEAAR), 62/39 (AcD3-LSSAGDSFSQFR) and 80/34 (AcD3-NVAAELVQGTVPLEVPQVK*PK*R). (c) A schematic diagram of the N-terminally Flag-tagged human Aven protein (aa 1–362). The binding sites for antisera used in this study (Aven CT, Aven A and Aven B) are indicated by black lines. The CathD cleavage sites (L144 and L196) that were identified by mass spectrometry analysis are labeled with arrowheads. Active ΔN-Aven represents the C-terminal fragment(s) produced by CathD cleavage, which displays anti-apoptotic activity
Figure 4
Figure 4
Aven co-localizes with CathD in cytosolic vesicles. Immunofluorescence analysis was performed in fixed MCF-7 cells with goat anti-human CathD antibody and rabbit anti-human Aven B (recognizing aa 256–268), followed by detection with appropriate secondary antibodies. CathD shows staining in endosomal compartments (upper panels) whereas Aven displays a fine vesicular cytosolic staining pattern (middle panels). Some cells also display a larger punctuate Aven staining that overlaps with CathD signals (lower panels; Aven: red, CathD: green)
Figure 5
Figure 5
Abrogation of CathD activity leads to increased Caspase-3 activity in MCF-7 cells after the induction of apoptosis. (a) Inhibition of CathD activity by treatment of MCF-7 cells with 40 μM pepstatin A leads to increased Caspase-3 activity after apoptosis induction by FasL, staurosporine or doxorubicin. Three independent experiments were performed, and the mean values are presented. Pepstatin A treatment resulted in significantly increased Caspase-3 activity following treatment with FasL, staurosporine or doxorubicin (P<0.01, P<0.05 and P<0.05, respectively; Student's t-test). (b) The knockdown of either Aven or CathD in MCF-7 cells led to increased Caspase-3 activity after apoptosis induction by 80 ng/ml FasL or 2 μM staurosporine treatment. The experiment was repeated three times independently, and the mean values are shown. The treatment with both apoptosis inducers led to a significant increase in Caspase-3 activity in shAven- and shCathD-transduced cells compared with control shRNA-transduced cells (P<0.05, One-way ANOVA with LSD/Bonferroni post-hoc analysis). The bars in a and b represent standard errors, with * and ** indicating P<0.05 and P<0.01, respectively
Figure 6
Figure 6
Aven self-interacts via the N-terminus. HEK 293T cells were co-transfected with full-length Aven-GFP, various Flag-tagged Aven (deletion) constructs (full-length Aven, ΔN-Aven 180–362, N-Aven 1–180) and empty vector (pc3.1). The transfection of GFP instead of Aven-GFP served as a negative control. Immunoprecipitation (IP) was performed using an anti-Flag antibody, and the membranes were probed with anti-Flag and anti-GFP antibodies. Input controls for each IP reaction are shown in the upper panel and represent 5% of total lysates. Arrows indicate the overexpressed Flag-tagged Aven mutants and the 25-kDa GFP band

References

    1. Brenner D, Mak TW. Mitochondrial cell death effectors. Curr Opin Cell Biol. 2009;21:871–877. - PubMed
    1. Ow YP, Green DR, Hao Z, Mak TW. Cytochrome c: functions beyond respiration. Nat Rev Mol Cell Biol. 2008;9:532–542. - PubMed
    1. Bao Q, Shi Y. Apoptosome: a platform for the activation of initiator caspases. Cell Death Differ. 2007;14:56–65. - PubMed
    1. Li P, Nijhawan D, Budihardjo I, Srinivasula SM, Ahmad M, Alnemri ES, et al. Cytochrome c and dATP-dependent formation of Apaf-1/caspase-9 complex initiates an apoptotic protease cascade. Cell. 1997;91:479–489. - PubMed
    1. D'Amelio M, Tino E, Cecconi F. The apoptosome: emerging insights and new potential targets for drug design. Pharm Res. 2008;25:740–751. - PMC - PubMed

Publication types

MeSH terms