. 2012 Apr 4;31(7):1836-46.
doi: 10.1038/emboj.2012.22. Epub 2012 Mar 2.

Structural insights into initial and intermediate steps of the ribosome-recycling process

Affiliations

Structural insights into initial and intermediate steps of the ribosome-recycling process

Takeshi Yokoyama et al. EMBO J. .

Abstract

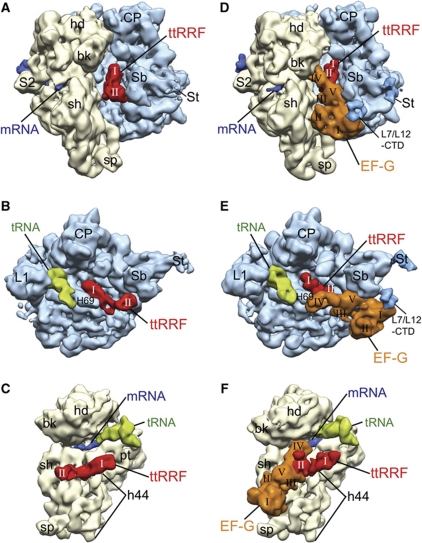
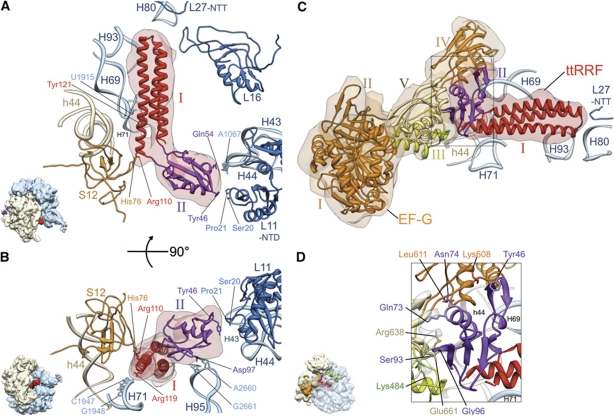
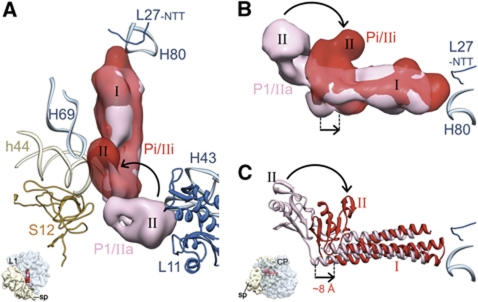
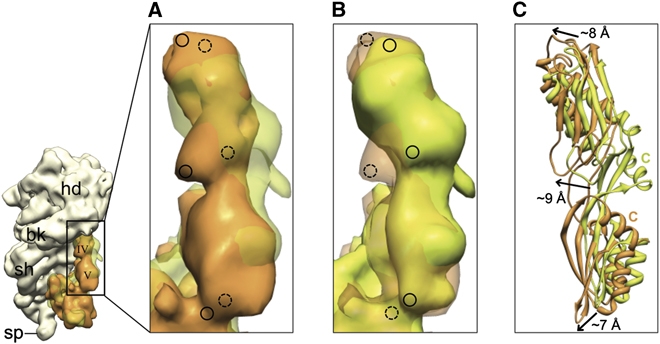
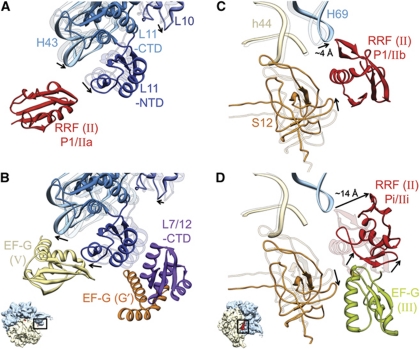
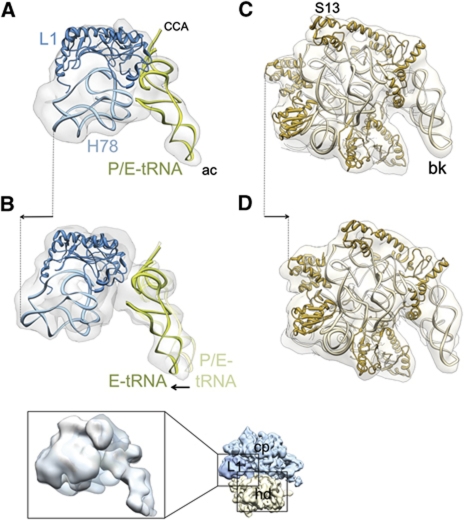
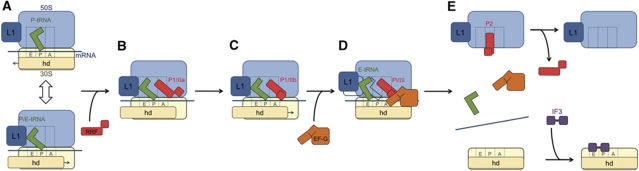
The ribosome-recycling factor (RRF) and elongation factor-G (EF-G) disassemble the 70S post-termination complex (PoTC) into mRNA, tRNA, and two ribosomal subunits. We have determined cryo-electron microscopic structures of the PoTC·RRF complex, with and without EF-G. We find that domain II of RRF initially interacts with universally conserved residues of the 23S rRNA helices 43 and 95, and protein L11 within the 50S ribosomal subunit. Upon EF-G binding, both RRF and tRNA are driven towards the tRNA-exit (E) site, with a large rotational movement of domain II of RRF towards the 30S ribosomal subunit. During this intermediate step of the recycling process, domain II of RRF and domain IV of EF-G adopt hitherto unknown conformations. Furthermore, binding of EF-G to the PoTC·RRF complex reverts the ribosome from ratcheted to unratcheted state. These results suggest that (i) the ribosomal intersubunit reorganizations upon RRF binding and subsequent EF-G binding could be instrumental in destabilizing the PoTC and (ii) the modes of action of EF-G during tRNA translocation and ribosome-recycling steps are markedly different.


Conflict of interest statement

The authors declare that they have no conflict of interest.

Figures

Figure 1
Figure 1
Segmented cryo-EM maps of the PoTC·ttRRF and PoTC·ttRRF·EF-G·GDP·FA complexes. (AC) The PoTC·ttRRF complex (complex 1): (A) The 70S ribosome (yellow, 30S subunit; and blue, 50S subunit) is viewed from the tRNA entry side, with strong densities for both domains (I and II) of ttRRF (red) clearly visible in the intersubunit space (see also Supplementary Figure S1A for a stereo viewing); (B) the same map is shown from the 50S interface side, where the 30S subunit has been computationally removed to reveal densities corresponding to ttRRF (in position P1/IIa) and deacylated tRNA (green, in the P/E site); and (C) the same complex is shown along with density corresponding to mRNA (dark blue) from the 30S interface side, without the 50S subunit. (DF) The PoTC·ttRRF·EF-G·GDP·FA complex (complex 2), shown in matching views with (AC): (D) Densities for both ttRRF and ecEF-G can be seen in the intersubunit space, with both domains of ttRRF and all five domains (I–V) of EF-G (orange) readily identifiable (see also Supplementary Figure S1B for a stereo viewing). Position occupied by domain II of ttRRF in (AC) is now occupied by domain V of EF-G; (E) the same complex is shown from the 50S interface side (without 30S subunit) to reveal densities corresponding to ttRRF (in intermediate position Pi), EF-G, and deacylated tRNA (in the P/E and E sites); and (F) the same complex shown along with density corresponding to mRNA (dark blue; see Supplementary Figure S3 for complete mRNA density) from the 30S interface side, without the 50S subunit. A marked shift in RRF position can be seen when compared with the RRF position in (C). Landmarks of the 30S subunit: bk, beak; hd, head; pt, platform; sh, shoulder; sp, spur; h44, 16S rRNA helix 44; and S2, protein S2. Landmarks of the 50S subunit: CP, central protuberance; L1, protein L1 stalk; L7/L12-CTD, C-terminal domain of protein L7/L12; Sb, stalk base (protein L11 region); St, L7/L12 stalk; and H69, 23S rRNA helix 69. In (D, E), densities corresponding to extended St and L7/L12-CTD are shown at slightly lower threshold values than the threshold value used for displaying the rest of the 50S subunit.
Figure 2
Figure 2
Interactions between the ribosome and ttRRF in complex 1 (A, B), and between ttRRF and EF-G in complex 2 (C, D). (A) Flexibly fitted atomic structure of ttRRF (red and purple ribbons, PDB ID; 1EH1) into the corresponding RRF density (semitransparent pink). Contacts and proximities between the amino-acid residues of ttRRF and ribosomal components, such as amino-acid residues of proteins L11 and S12 and nucleotides of the 23S rRNA helices 43 (H43) and 69 (H69) are indicated. Domains I and II of the fitted ttRRF coordinates are depicted in red and purple, respectively. (B) Same as in (A), but rotated around a horizontal axis by ∼90°, to reveal interactions between an amino-acid residue of domain II of ttRRF and conserved nucleotides of the 23S rRNA helix 95 (H95), and between domain I of ttRRF and helix 71 (H71) of the 23S rRNA. (C) Flexibly fitted atomic structures of ttRRF and the homology model of E. coli EF-G into the corresponding cryo-EM densities of ttRRF (semitransparent red, in the intermediate position Pi) and EF-G (semitransparent orange), respectively, are shown with the ribosomal components present in the immediate vicinity of RRF. EF-G domains I–V are shown in distinctive colours, I (orange), II (brown), III (green), IV (orange) and V (yellow). L27-NTT refers to the N-terminal tail of protein L27. (D) Enlarged boxed area in (C) to reveal ribosomal neighbourhood of ttRRF in the position Pi and interaction of domain II of ttRRF with EF-G domains III–V. Five select pairs of amino-acid interactions are labelled (see also Supplementary Table S1B for the complete list of amino-acid interactions between ttRRF and EF-G). All helices of the 16S and 23S rRNAs are identified with h and H, respectively; while ribosomal proteins of the small and large subunits are prefixed by S and L, respectively. Thumbnails to the lower left of (A, B, D) depict overall orientations of the ribosome.
Figure 3
Figure 3
Comparison of ttRRF-binding positions before and after EF-G binding. (A, B) Cryo-EM densities and (C) flexibly fitted atomic coordinates corresponding to ttRRF in complex 1 (pink) and complex 2 (red) are superimposed. The overall direction and magnitude of ttRRF movement is depicted by straight arrows. The direction of rotational shift in domain II of ttRRF, upon EF-G binding, is indicated with curved arrows (see also Supplementary Figure S6). Thumbnails to the lower left in (A, C) depict the orientation of the 70S ribosome: In (A), the ribosome is in top view, whereas in (B, C) it is shown from the L7/L12 stalk side of the 50S subunit to reveal the shift in the elbow region of RRF.
Figure 4
Figure 4
Positions of domains IV and V of EF-G in the presence and absence of ttRRF on the ribosome. (A) Corresponding cryo-EM densities of domains IV and V of EF-G in complex 2 (orange) and the 70S·EF-G·GDP·FA complex (semitransparent green (Datta et al, 2005)) are superimposed. (B) Same as in panel A, but the transparency has been switched to reveal marked shifts in the position of EF-G domains. Dashed and solid circles in (A, B) highlight the equivalent positions in semitransparent and solid densities. (C) Flexibly fitted coordinates of EF-G domains IV and V into the maps shown in (A) are superimposed. Arrows depict the direction and magnitude of shifts in EF-G domains as compared with their positions in the absence of ttRRF. C, C-terminal α-helix.
Figure 5
Figure 5
Movements of domain II of RRF, and conformational changes of ribosomal components that interact with RRF and EF-G. Fitted atomic structures of the ribosomal components in two functionally relevant regions are shown. (A, B) The L11 Sb region; and (C, D) the bridge B2a region, shown along with protein S12. In each panel, fitted structures of two functional states are shown. In (A, C), the ribosomal components of the PoTC complex are shown as semitransparent ribbons, while those of complex 1 are shown as solid ribbons. Similarly, in (B, D), ribosomal components of complex 1 are shown as semitransparent ribbons, whereas those of complex 2 are shown as solid ribbons. Arrows point to movements in the ribosomal components and RRF. Domain II of RRF in specified positions (A, C, D), domains V and G’ of EF-G (B), and domain III of EF-G (D) are also shown. Since only a weak density for domain II of RRF in P1/IIb configuration was observed in this study, its corresponding position in (C) is based on previous studies (Agrawal et al, 2004; Pai et al, 2008). The position of L7/L12-CTD shown in (B) is similar to that derived in previous cryo-EM (Datta et al, 2005) and X-ray crystallographic (Gao et al, 2009) studies (also see Supplementary Figure S11). Thumbnails to lower left of (B, D) depict the orientations of the 70S ribosome in (A, B) and (C, D), respectively.
Figure 6
Figure 6
Conformational changes of the ribosome and tRNA movement due to binding of RRF and EF-G. Each structure was aligned, using the core portion of the 50S subunit of the cryo-EM maps as the main guide. (A, B) Movement of the L1 stalk (light blue, rRNA helices 77 and 78; dark blue, protein L1) and tRNA (green) during transition from (A) complex 1 to (B) complex 2. (C, D) Movement of the 30S subunit head (light brown, 16S rRNA; dark brown, 30S subunit head proteins) during transition from (C) complex 1 to (D) complex 2. Cryo-EM densities are shown as semitransparent grey. In all panels, the ribosomes are viewed from the top, in an overall orientation depicted in the thumbnail at the lower right. In (A, B), only the L1 stalk region (corresponding to left boxed area on the thumbnail) of the 50S subunits, and in (C, D), only the head portion (corresponding to lower right boxed area on the thumbnail) of the 30S subunits are shown (see also Supplementary Figure S7 for the overall conformational changes). The inset shown below (B) depicts the split densities for tRNA anticodons between the P (semitransparent) and E (solid) sites in complex 2. Arrows indicate major movements (see Supplementary Figure S8 for stereo viewing of the tRNA movement). Landmarks: ac, anticodon end; CCA, acceptor end; H78, helix 78 of the 23S rRNA; S13, small ribosomal subunit protein S13. The rest of the landmarks of the ribosomal subunits are the same as in Figure 1.
Figure 7
Figure 7
Schematic diagram showing steps of the recycling process. (A) The model PoTC, with 30S (yellow) and 50S (blue) subunit. The head (hd) of the 30S subunit is depicted in a darker-shade block to indicate its relative position with respect to the rest of the 30S subunit body. Three canonical tRNA-binding sites, A, P and E, are depicted by dotted lines on both ribosomal subunits. The deacylated tRNA (green) is shown to fluctuate between P/P (P-tRNA, upper panel) and P/E (P/E-tRNA, lower panel) sites between the two ribosomal populations in dynamic equilibrium. (B) Initial binding of RRF in position P1/IIa, where domain II of RRF is oriented towards the 50S subunit and tRNA is exclusively in the P/E site, with the 30S subunit rotated in an anticlockwise direction (complex 1). (C) Subsequent reorientation of domain II towards the 30S subunit to attain position P1/IIb. (D) Binding of EF-G shifts RRF to position Pi/IIi, tRNA anticodon moves from P to E site in a subpopulation of complex 2, while the head of the 30S subunit is fully rotated back to its original position. (E) Depiction of final disassembly of the PoTC through concomitant movement of RRF to P2/IIb, a position exclusively attained on the 50S subunit during the subunit dissociation (Barat et al, 2007). The precise sequence of events that leads to release of all bound components is not known, while binding of IF3 to the 30S subunit keeps the latter from re-associating with the 50S subunit to facilitate the translation re-initiation. Relative positions of the blocks representing 30S subunit body and head in (AD) depict movements of those 30S-subunit domains with respect to the 50S subunit.

Similar articles

Cited by

References

    1. Ævarsson A, Brazhnikov E, Garber M, Zheltonosova J, Chirgadze Y, al-Karadaghi S, Svensson LA, Liljas A (1994) Three-dimensional structure of the ribosomal translocase: elongation factor G from Thermus thermophilus. EMBO J 13: 3669–3677 - PMC - PubMed
    1. Agirrezabala X, Lei J, Brunelle JL, Ortiz-Meoz RF, Green R, Frank J (2008) Visualization of the hybrid state of tRNA binding promoted by spontaneous ratcheting of the ribosome. Mol Cell 32: 190–197 - PMC - PubMed
    1. Agrawal RK, Heagle AB, Penczek P, Grassucci RA, Frank J (1999a) EF-G-dependent GTP hydrolysis induces translocation accompanied by large conformational changes in the 70S ribosome. Nat Struct Biol 6: 643–647 - PubMed
    1. Agrawal RK, Penczek P, Grassucci RA, Burkhardt N, Nierhaus KH, Frank J (1999b) Effect of buffer conditions on the position of tRNA on the 70S ribosome as visualized by cryoelectron microscopy. J Biol Chem 274: 8723–8729 - PubMed
    1. Agrawal RK, Penczek P, Grassucci RA, Frank J (1998) Visualization of elongation factor G on the Escherichia coli 70S ribosome: the mechanism of translocation. Proc Natl Acad Sci USA 95: 6134–6138 - PMC - PubMed

Publication types

MeSH terms

LinkOut - more resources