

Expression of the aryl hydrocarbon receptor is not required for the proliferation, migration, invasion, or estrogen-dependent tumorigenesis of MCF-7 breast cancer cells
- PMID: 22388733
- PMCID: PMC3433635
- DOI: 10.1002/mc.21889
Expression of the aryl hydrocarbon receptor is not required for the proliferation, migration, invasion, or estrogen-dependent tumorigenesis of MCF-7 breast cancer cells
Abstract
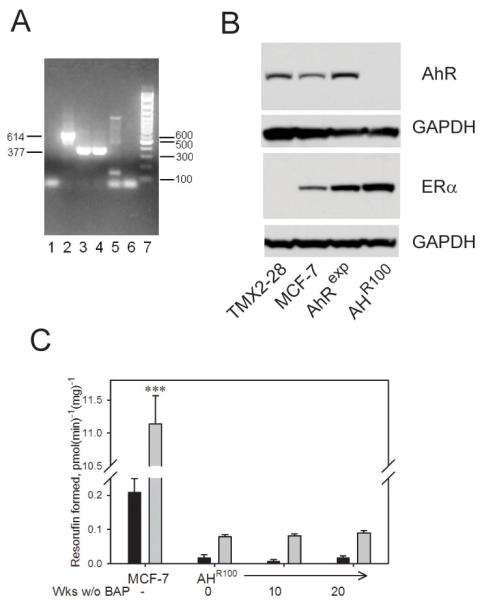
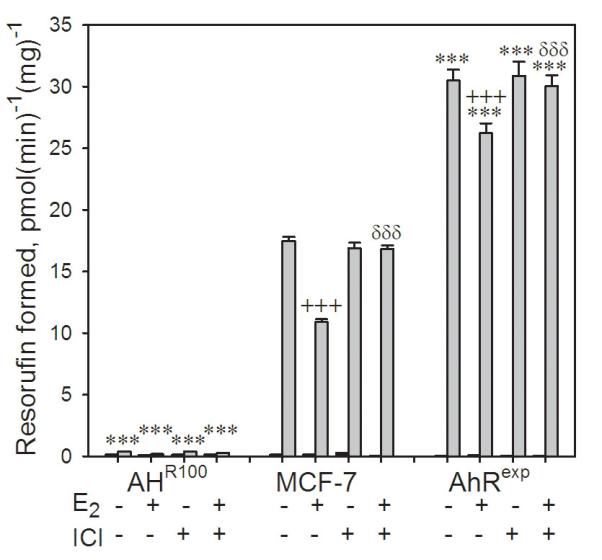
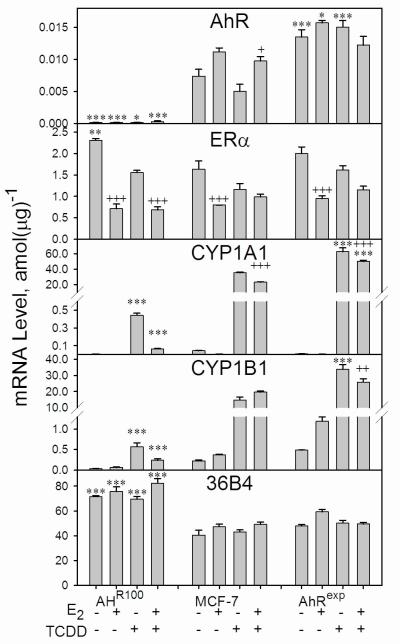
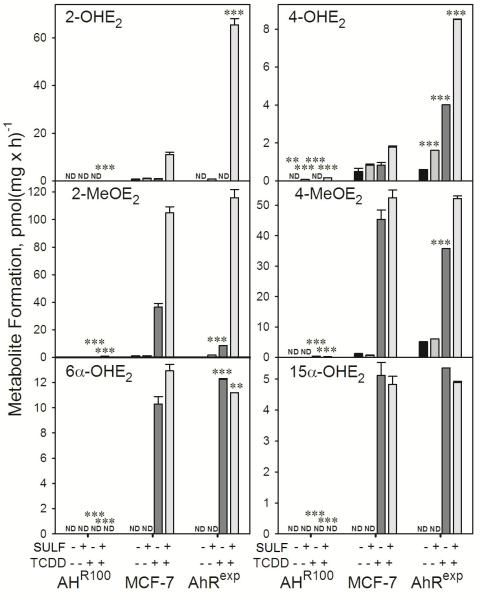
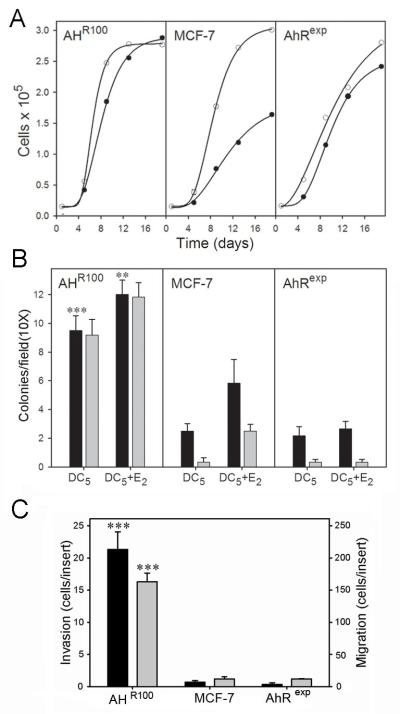
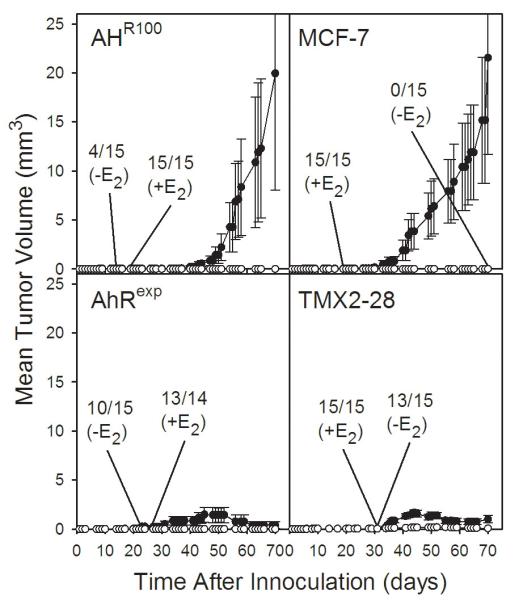
The AhR was initially identified as a ligand-activated transcription factor mediating effects of chlorinated dioxins and polycyclic aromatic hydrocarbons on cytochrome P450 1 (CYP1) expression. Recently, evidence supporting involvement of the AhR in cell-cycle regulation and tumorigenesis has been presented. To further define the roles of the AhR in cancer, we investigated the effects of AhR expression on cell proliferation, migration, invasion, and tumorigenesis of MCF-7 human breast cancer cells. In these studies, the properties of MCF-7 cells were compared with those of two MCF-7-derived sublines: AH(R100) , which express minimal AhR, and AhR(exp) , which overexpress AhR. Quantitative PCR, Western immunoblots, 17β-estradiol (E2 ) metabolism assays, and ethoxyresorufin O-deethylase assays showed the lack of AhR expression and AhR-regulated CYP1 expression in AH(R100) cells, and enhanced AhR and CYP1 expression in AhR(exp) cells. In the presence of 1 nM E2 , rates of cell proliferation of the three cell lines showed an inverse correlation with the levels of AhR mRNA. In comparison with MCF-7 and AhR(exp) cells, AH(R100) cells produced more colonies in soft agar and showed enhanced migration and invasion in chamber assays with E2 as the chemoattractant. Despite the lack of significant AhR expression, AH(R100) cells retained the ability to form tumors in severe combined immunodeficient mice when supplemented with E2 , producing mean tumor volumes comparable to those observed with MCF-7 cells. These studies indicate that, while CYP1 expression and inducibility are highly dependent on AhR expression, the proliferation, invasion, migration, anchorage-independent growth, and estrogen-stimulated tumor formation of MCF-7 cells do not require the AhR.
Copyright © 2012 Wiley Periodicals, Inc.
Figures
Similar articles
-
Aryl hydrocarbon receptor activation of an antitumor aminoflavone: basis of selective toxicity for MCF-7 breast tumor cells.Mol Cancer Ther. 2004 Jun;3(6):715-25. Mol Cancer Ther. 2004. PMID: 15210858
-
Estrogen regulates Ah responsiveness in MCF-7 breast cancer cells.Carcinogenesis. 2003 Dec;24(12):1941-50. doi: 10.1093/carcin/bgg162. Epub 2003 Sep 11. Carcinogenesis. 2003. PMID: 12970067
-
12-O-tetradecanoylphorbol-13-acetate upregulates the Ah receptor and differentially alters CYP1B1 and CYP1A1 expression in MCF-7 breast cancer cells.J Cell Biochem. 1998 Sep 1;70(3):289-96. J Cell Biochem. 1998. PMID: 9706865
-
Cytochrome P450 1 family and cancers.J Steroid Biochem Mol Biol. 2015 Mar;147:24-30. doi: 10.1016/j.jsbmb.2014.11.003. Epub 2014 Nov 6. J Steroid Biochem Mol Biol. 2015. PMID: 25448748 Review.
-
Timing is everything: consequences of transient and sustained AhR activity.Biochem Pharmacol. 2009 Mar 15;77(6):947-56. doi: 10.1016/j.bcp.2008.10.028. Epub 2008 Nov 6. Biochem Pharmacol. 2009. PMID: 19027718 Free PMC article. Review.
Cited by
-
The Role of the Aryl Hydrocarbon Receptor (AhR) and Its Ligands in Breast Cancer.Cancers (Basel). 2022 Nov 14;14(22):5574. doi: 10.3390/cancers14225574. Cancers (Basel). 2022. PMID: 36428667 Free PMC article. Review.
-
RMP plays distinct roles in the proliferation of hepatocellular carcinoma cells and normal hepatic cells.Int J Biol Sci. 2013 Jul 5;9(6):637-48. doi: 10.7150/ijbs.6439. Print 2013. Int J Biol Sci. 2013. PMID: 23847445 Free PMC article.
-
Analysis of the AHR gene proximal promoter GGGGC-repeat polymorphism in lung, breast, and colon cancer.Toxicol Appl Pharmacol. 2015 Jan 1;282(1):30-41. doi: 10.1016/j.taap.2014.10.017. Epub 2014 Nov 4. Toxicol Appl Pharmacol. 2015. PMID: 25447411 Free PMC article.
-
Aryl hydrocarbon receptor (AHR) is a potential tumour suppressor in pituitary adenomas.Endocr Relat Cancer. 2017 Aug;24(8):445-457. doi: 10.1530/ERC-17-0112. Epub 2017 Jun 25. Endocr Relat Cancer. 2017. PMID: 28649092 Free PMC article.
-
AhR expression is increased in hepatocellular carcinoma.J Mol Histol. 2013 Aug;44(4):455-61. doi: 10.1007/s10735-013-9495-6. Epub 2013 Apr 2. J Mol Histol. 2013. PMID: 23547017
References
-
- Denison MS, Nagy SR. Activation of the aryl hydrocarbon receptor by structurally diverse exogenous and endogenous chemicals. Annu Rev Pharmacol Toxicol. 2003;43:309–334. - PubMed
-
- Wei YD, Bergander L, Rannug U, Rannug A. Regulation of CYP1A1 transcription via the metabolism of the tryptophan-derived 6-formylindolo[3,2-b]carbazole. Arch Biochem Biophys. 2000;383(1):99–107. - PubMed
-
- Adachi J, Mori Y, Matsui S, et al. Indirubin and indigo are potent aryl hydrocarbon receptor ligands present in human urine. J Biol Chem. 2001;276(34):31475–31478. - PubMed
Publication types
MeSH terms
Substances
Grants and funding
LinkOut - more resources
Full Text Sources
Medical
