. 2012 Feb 29;483(7388):222-6.
doi: 10.1038/nature10849.

An epigenetic blockade of cognitive functions in the neurodegenerating brain

Affiliations

An epigenetic blockade of cognitive functions in the neurodegenerating brain

Johannes Gräff et al. Nature. .

Abstract

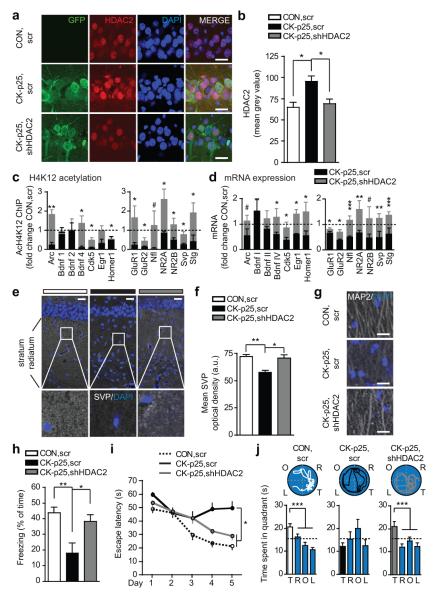
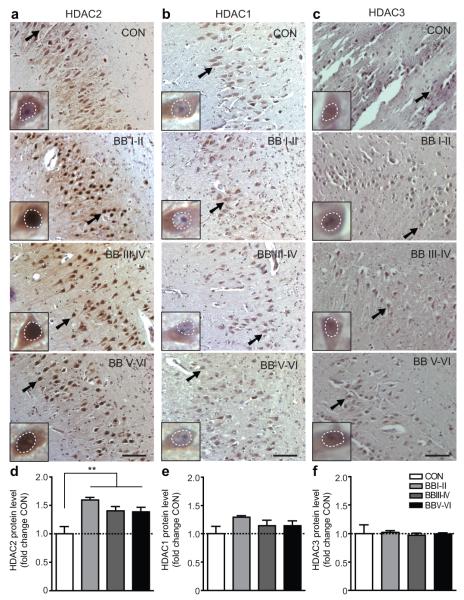
Cognitive decline is a debilitating feature of most neurodegenerative diseases of the central nervous system, including Alzheimer's disease. The causes leading to such impairment are only poorly understood and effective treatments are slow to emerge. Here we show that cognitive capacities in the neurodegenerating brain are constrained by an epigenetic blockade of gene transcription that is potentially reversible. This blockade is mediated by histone deacetylase 2, which is increased by Alzheimer's-disease-related neurotoxic insults in vitro, in two mouse models of neurodegeneration and in patients with Alzheimer's disease. Histone deacetylase 2 associates with and reduces the histone acetylation of genes important for learning and memory, which show a concomitant decrease in expression. Importantly, reversing the build-up of histone deacetylase 2 by short-hairpin-RNA-mediated knockdown unlocks the repression of these genes, reinstates structural and synaptic plasticity, and abolishes neurodegeneration-associated memory impairments. These findings advocate for the development of selective inhibitors of histone deacetylase 2 and suggest that cognitive capacities following neurodegeneration are not entirely lost, but merely impaired by this epigenetic blockade.


Figures

Figure 1
Figure 1. Elevated HDAC2 levels epigenetically block the expression of neuroplasticity genes during neurodegeneration
a-c, Representative immunohistochemical images depicting HDAC1-3 levels in area CA1 of CK-p25 mice and control littermates (n=3-6 slices from 3-4 mice each), scale bar, 20μm. d, Quantitative assessment of (a-c). e, Representative WB images and quantification of HDAC1-3 protein in the CK-p25 and control hippocampus (n=6-9 mice each). f-h, Quantitative PCR results of (f) HDAC2-, (g) AcH4K12-, and (h) RNA Pol II-immunoprecipitated chromatin at the promoter of neuroplasticity and housekeeping genes in the CK-p25 and control hippocampus. (i), Quantitative RT-PCR results of the same genes (f-i, n=4-8 animals each). Note that for (i) Bdnf “1”, “2” and “4” represent Bdnf exons I, II and IV, respectively. *p≤0.05; **p≤0.01; ***p≤0.001, values are mean ± s.e.m.
Figure 2
Figure 2. Reducing HDAC2 levels alleviates memory deficits
a, Representative immunohistochemical images depicting HDAC2 in hippocampal area CA1 of CK-p25, shHDAC2, CK-p25, scr, and CON, scr animals; scale bar, 20μm. b, Quantitative assessment of (a), n=4-5 sections from 4 mice each. c, Quantitative PCR results of AcH4K12-immunoprecipitated chromatin in CK-p25, scr and CK-p25, shHDAC2 compared to CON, scr mice. d, Quantitative RT-PCR results of the same genes. (c, d, n=4-6 animals each). e, g, Representative immunohistochemical images depicting (c) Svp and (e) MAP2 immunoreactivity in the hippocampus stratum radiatum, scale bars c, 25μm, e, 20μm f, Quantitative assessment of (c), n=4 mice each. f, Freezing responses of CON, scr (n=18), CK-p25, scr (n=16) and CK-p25, shHDAC2 (n=16) mice 24 h after contextual fear conditioning. g, Escape latencies in a water maze task of CON, scr (n=19), CK-p25, scr (n=17) and CK-p25, shHDAC2 (n=19) animals. Data points are averages of two trials per day. h, Representative swim traces and time spent per quadrant during the water maze test (T, target quadrant, R=right, O=opposite, L=left of target). *p≤0.05; **p≤0.01; ***p≤0.001, values are mean ± s.e.m.
Figure 3
Figure 3. Neurotoxic insults increase HDAC2 via stress elements in its promoter
a, c, Representative pictures of HDAC2 and PGR1 labeling of primary hippocampal neurons treated with (a) H2O2 and (c) Aβ-oligomers (n=20-40 neurons per group), scale bar, 10μm. b, d, Quantification of (a) and (c). e, f, Quantitative RT-PCR results showing Hdac2 expression in (e) H2O2- and Aβ-treated primary hippocampal neurons, and (f) in the CK-p25 hippocampus (n=7-9 mice each). g, Alignment of the vertebrate glucocorticoid responsive element (GRE) consensus sequence with the GRE in the proximal promoter of mouse Hdac2. h, Quantification and representative WB images of hippocampal extracts of CK-p25 versus control mice (n=3 each). i, Representative images of immunohistochemical labeling of PGR1 and HDAC2 in the CK-p25 hippocampus (n=3-6 slices from 3 mice each); scale bar, 20μm. j, Regression analysis of (i) showing a significant correlation between PGR1 and HDAC2 in CK-p25 (R2=0.686, p≤0.001), but not control mice (R2=0.019, n.s.). k, Quantification and representative WB images of Cdk5cKO and control Cdk5fl/fl forebrain extracts (n=3 each). l, Quantitative PCR results of PGR1-immunoprecipitated chromatin around the GRE in a 1.3 kb-wide Hdac2 promoter region (schematically shown above the graph; TSS, transcriptional start site) in the CK-p25 and control hippocampus (n=3-6 animals each); green lines represent fragments amplified by primer pairs. m, Luciferase activity of CAD cells transfected with the Hdac2 promoter with (orange) or without (blue) GRE (schematic of constructs shown above graph), and treated with H2O2 and Aβ1-42. n, Luciferase activity of CAD cells transfected with Hdac2-GRE in the presence of endogenous GR or of cotransfected GRS211A. In vitro results are from ≥3 independent experiments. *p≤0.05; **p≤0.01; ***p≤0.001, values are mean ± s.e.m.
Figure 4
Figure 4. HDAC2 expression is increased in Alzheimer’s disease patients
a-c, Representative immunohistochemical images depicting nuclear HDAC1-3 levels (white dotted circles) in neurons (arrow points to magnified neuron in inset) of hippocampal area CA1 from patients with Braak and Braak (BB) stages I/II (n=4), III/IV (n=7) and V/VI (n=8) compared to healthy BB0 control brains (CON, n=7); scale bar, 100μm. d-e, Quantitative assessment of (a-c). **p≤0.01, values are mean ± s.e.m.

Similar articles

Cited by

References

    1. Walsh DM, Selkoe DJ. Deciphering the molecular basis of memory failure in Alzheimer’s disease. Neuron. 2004;44:181–93. - PubMed
    1. Holtzman DM, Morris JC, Goate AM. Alzheimer’s disease: the challenge of the second century. Sci Transl Med. 2011;3:77sr1. - PMC - PubMed
    1. Kandel ER. The molecular biology of memory storage: a dialogue between genes and synapses. Science. 2001;294:1030–8. - PubMed
    1. Gräff J, Kim D, Dobbin MM, Tsai LH. Epigenetic regulation of gene expression in physiological and pathological brain processes. Physiol Rev. 2011;91:603–49. - PubMed
    1. Brownell JE, Allis CD. Special HATs for special occasions: linking histone acetylation to chromatin assembly and gene activation. Curr Opin Genet Dev. 1996;6:176–84. - PubMed

Publication types

MeSH terms