Comparative Study
. 2012 Mar 4;15(4):565-73.
doi: 10.1038/nn.3059.

The voltage-gated proton channel Hv1 enhances brain damage from ischemic stroke

Affiliations
Comparative Study

The voltage-gated proton channel Hv1 enhances brain damage from ischemic stroke

Long-Jun Wu et al. Nat Neurosci. .

Abstract

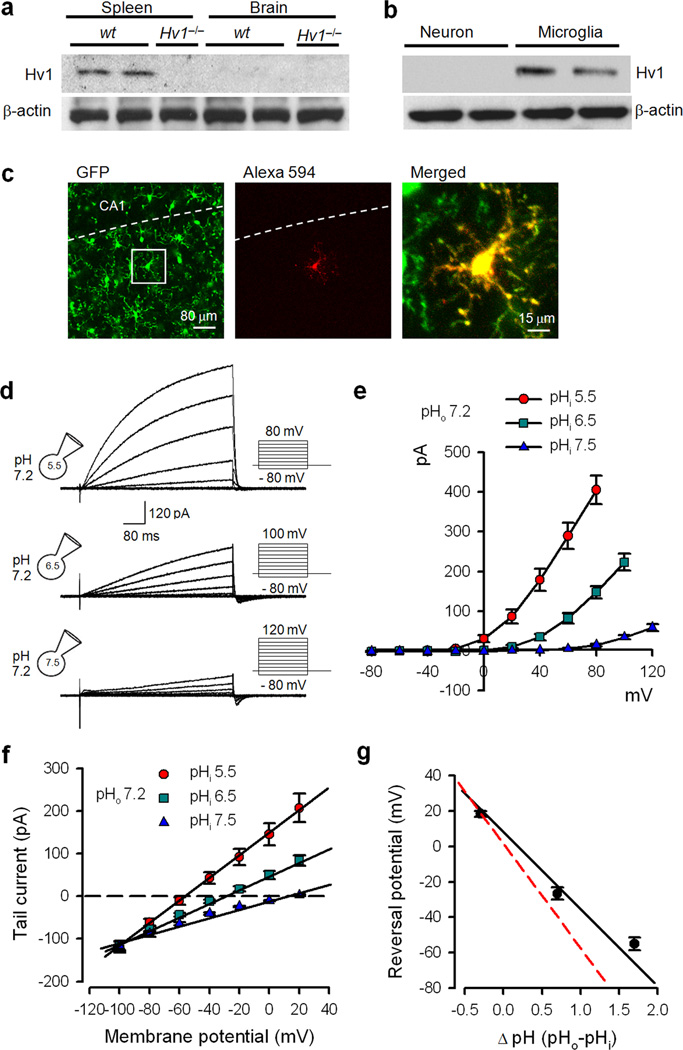
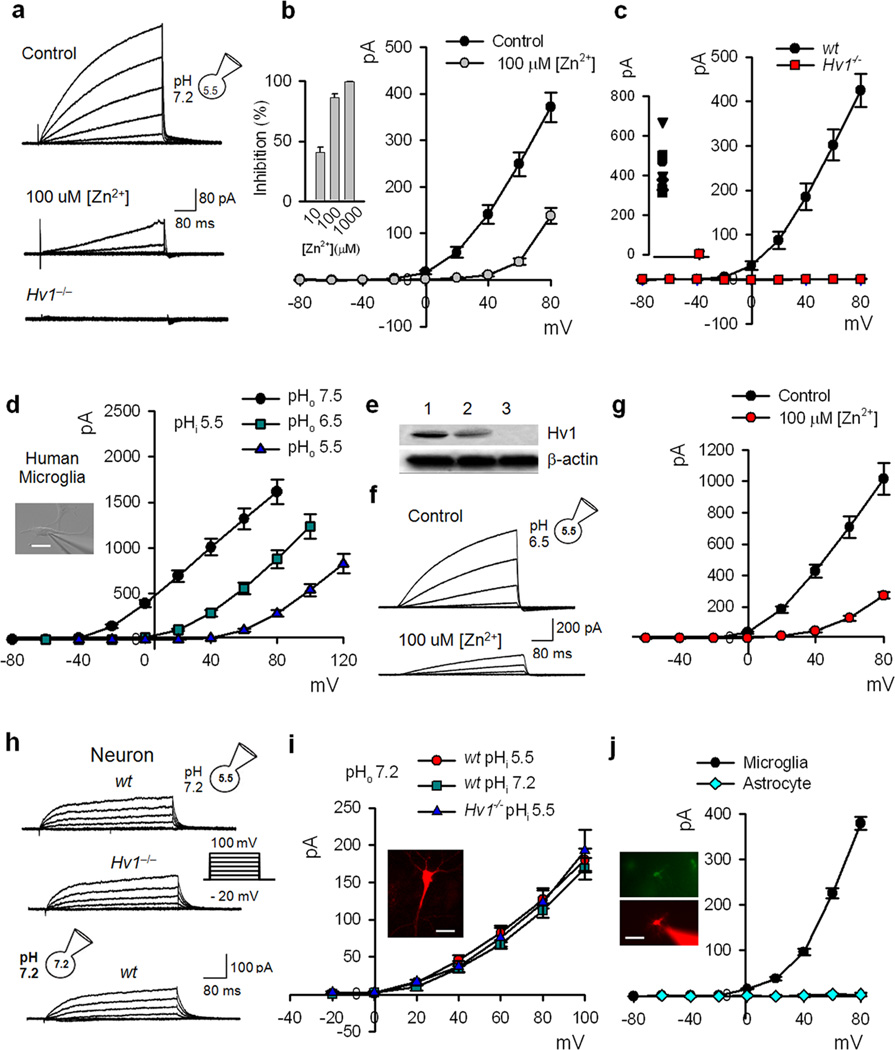
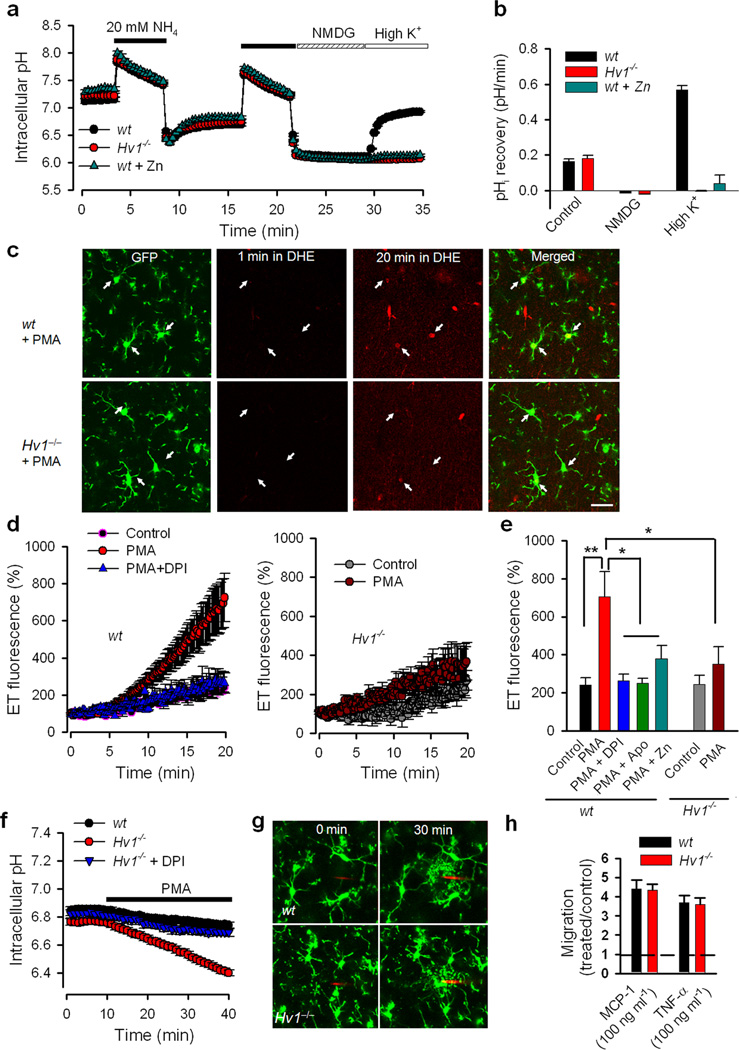
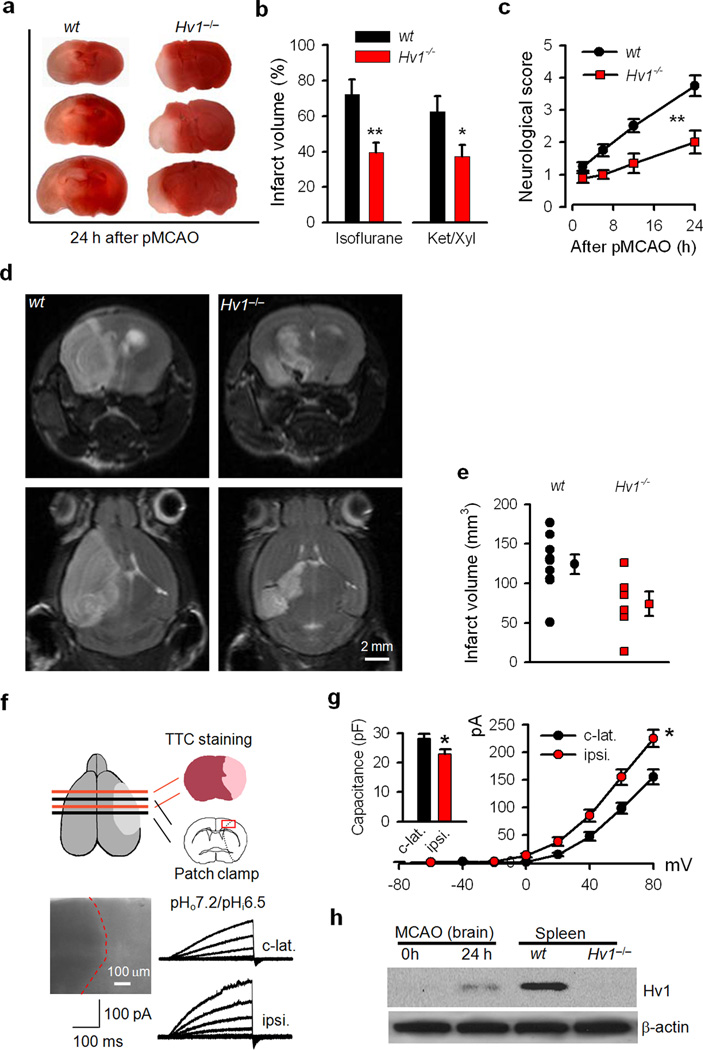
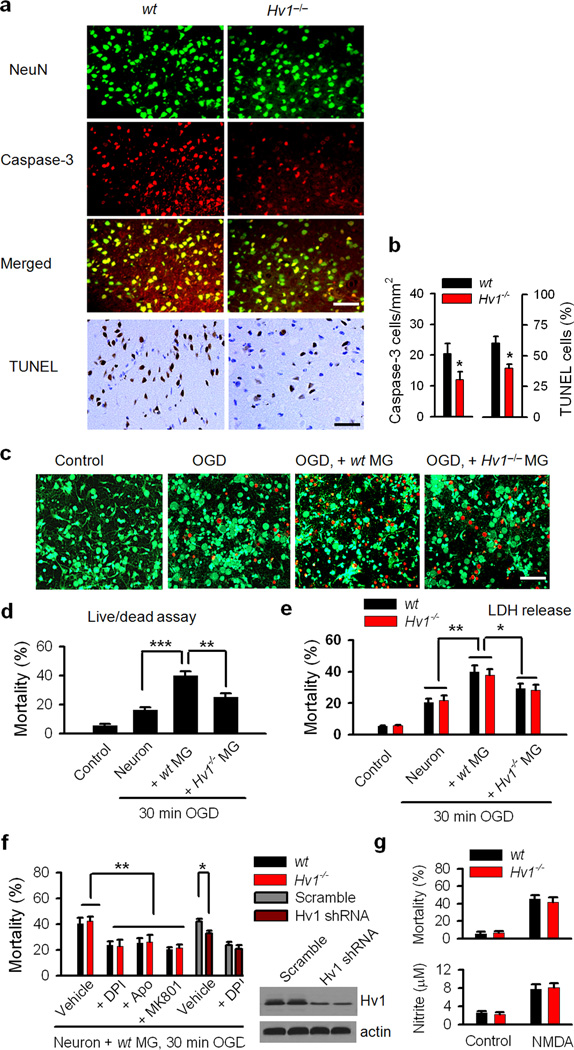
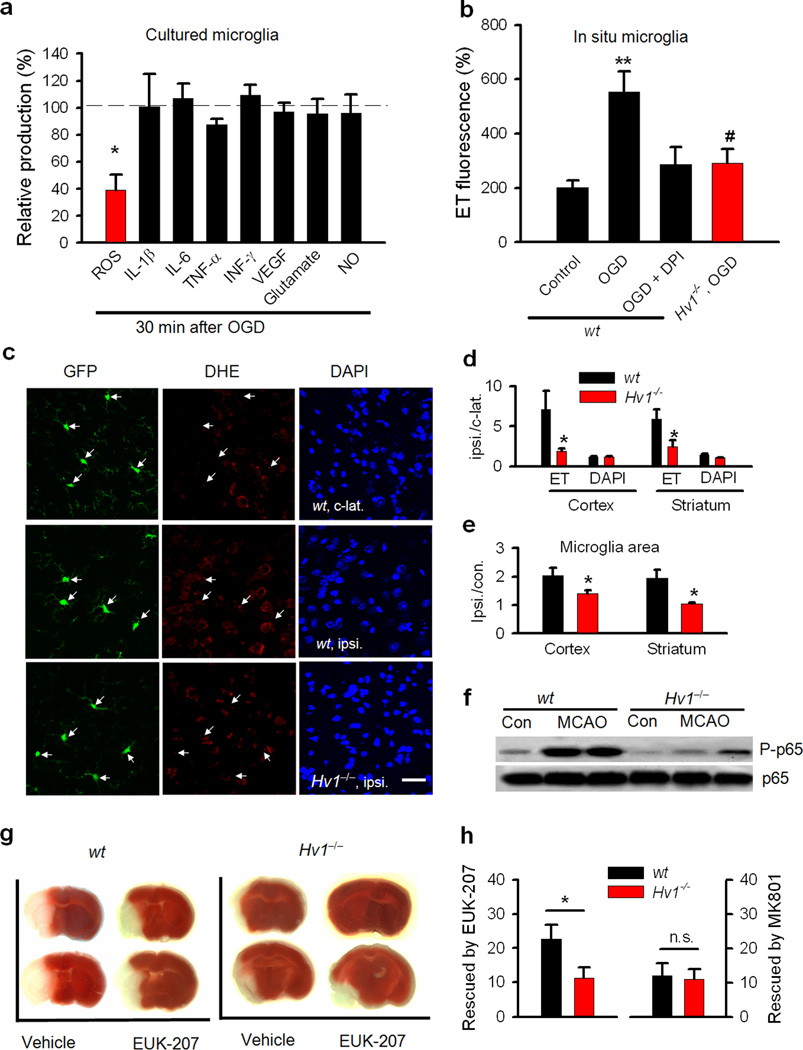
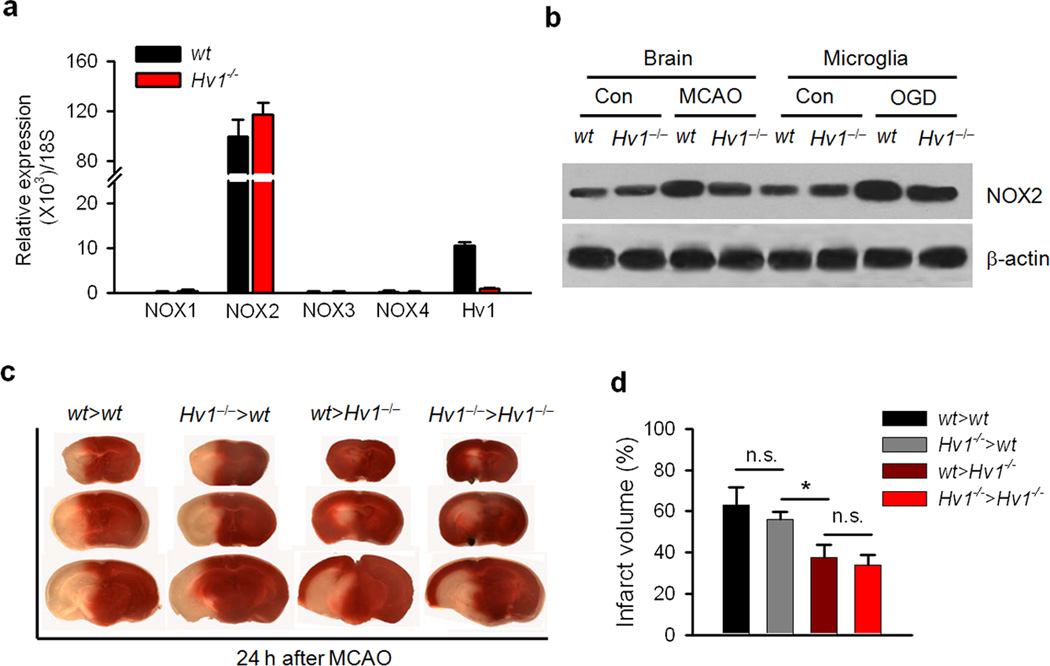
Phagocytic cell NADPH oxidase (NOX) generates reactive oxygen species (ROS) as part of innate immunity. Unfortunately, ischemia can also induce this pathway and inflict damage on native cells. The voltage-gated proton channel Hv1 enables NOX function by compensating cellular loss of electrons with protons. Accordingly, we investigated whether NOX-mediated brain damage in stroke can be inhibited by suppression of Hv1. We found that mouse and human brain microglia, but not neurons or astrocytes, expressed large Hv1-mediated currents. Hv1 was required for NOX-dependent ROS generation in brain microglia in situ and in vivo. Mice lacking Hv1 were protected from NOX-mediated neuronal death and brain damage 24 h after stroke. These results indicate that Hv1-dependent ROS production is responsible for a substantial fraction of brain damage at early time points after ischemic stroke and provide a rationale for Hv1 as a therapeutic target for the treatment of ischemic stroke.


Figures

Figure 1
Figure 1. Voltage–gated proton currents in hippocampal microglia in mouse brain slices
(a) Hv1 protein was detected by Western blot (α1–Hv1) in the spleen, but not in whole brain lysates (also see Suppl. Fig. 14a). (b) Hv1 protein was detected by Western blot (α1–Hv1) in cultured microglia but not in cultured neurons (also see Suppl. Fig. 14b). (c) A GFP–expressing microglia (shown in white box) in mouse hippocampus labeled with Alexa Fluor 594 prior to whole–cell recording. Dashed line delineates the CA1 region of the hippocampus. (d) Outward currents induced by voltage steps in hippocampal microglia. Inset: Stimulation protocol and intra– and extracellular pH (pHi and pHo). Increased intracellular pH decreased the outward current and shifted the activation threshold to more depolarized potentials. (e) Pooled data of current–voltage relationships at pHi 5.5, 6.5 and 7.5; pHo=7.2. Current amplitude was measured at the end of the 500ms depolarization pulse (n=8–10). (f) Reversal potentials were determined by tail current recordings. The tail current was recorded at various potentials from –100mV to +20mV after activation of the outward current by a voltage step to +60mV for 1 s (n=7). (g) Plot of the current reversal potential at different pHo/pHi gradients. Data were fitted by a continuous line with a slope of –38mV/ΔpH. The Nernst potential for a proton–selective membrane has a slope of –58mV/ΔpH (red line). Differences from the predicted Nernst relation are due to proton depletion. Data are mean ± s.e.m.
Figure 2
Figure 2. Hv1 mediates the voltage–gated proton current in mouse brain microglia but not in neurons or astrocytes
(a) Inhibition of outward current by 100µM Zn2; from microglia (pHo7.2/pHi5.5) in a hippocampal brain slice. No outward current was observed in Hv1−/− microglia. (b) Voltage–gated proton current amplitudes in control solution or with100µM Zn2+. Zn2+ shifts the Hv1 activation threshold. Inset: concentration–dependent inhibition by Zn2+ at +60mV (n=6). (c) Absence of proton current in Hv1−/− hippocampal microglia. Inset: currents at +80mV (n=8 wt, 6 Hv1−/−). (d) Increasing pHo increases voltage–gated proton current in human microglia (n=9–11). Inset: microglia, scale bar, 50µm. (e) Hv1 protein in human microglia (2). Wt (1) and Hv1−/− (3) mouse spleens were used as control. α1–Hv1 antibody was used (also see Suppl. Fig. 14c). (f) 100µM Zn2+ inhibits proton current in human microglia. (g) Pooled results show the Zn2+ inhibition of voltage–current relationship of proton current in human microglia (n=8). (h) Whole–cell currents (primarily Kv) in hippocampal CA1 neurons (pHo7.2/pHi5.5; wt and Hv1−/− neurons) and pHo7.2/pHi7.2 (wt neurons). (i) Outward K+ current amplitudes in wt and Hv1−/− hippocampal neurons are not different. Currents were not substantially altered by varying pHi (n=6–7 for each group). Inset: CA1 neuron labeled with Alexa Fluor 594 during recording. Scale bar, 80µm. (j) No proton current was recorded in astrocytes from P3 mice (n=7). Inset: GFP–positive astrocyte labeled with Alexa Fluor 594 during recording. Scale bar, 80µm. Data are mean ± s.e.m.
Figure 3
Figure 3. Hv1 regulates microglial acid extrusion and controls NADPH oxidase–dependent ROS production in situ
(a) Intracellular pH (pHi) change of wt (n=29) or Hv1−/− microglia (n=23) in response to NH4+–induced acid load, and pHi recovery in control high Na+ solution, Na+–free solution, and Na+–free, high-K+ solution. High K+–induced pHi recovery in wt microglia inhibited by Zn2+ (n=16). (b) pHi recovery rate (first min) after NH4+–induced acid load. (c) PMA–induced ROS production in microglia (arrows) from Cx3cr1GFP/+ and Cx3cr1GFP/+Hv1−/− mice. ROS converts DHE to fluorescent ethidium (ET, red) bar = 20 microns. (d) Increased ROS in wt (left, n=11 controls; 13 PMA–treated) and Hv1−/− (right, n=7 controls and 8 PMA–treated) microglia. 30µM DPI reduced ROS increase in wt (brain slices; n=6). (e) DPI, apocynin (Apo) or Zn2+ reduced ET fluorescence in PMA–stimulated wt microglia. PMA–induced ROS was in Hv1−/− was half that of PMA–stimulated wt microglia. (f) pHi in response to PMA treatment in wt (n=30) and Hv1−/− microglia (n=48). Na+–free solution blocked Na+–dependent acid extrusion. PMA–induced intracellular acidification was inhibited by DPI (n=25). (g) ATP–induced terminal chemotaxis was comparable between wt (upper) and Hv1−/− (lower) mice (n=3). Alexa Fluor 594 in pipette (red). (h) Migration in response to 100ng/ml MCP–1 or 100ng/ml TNFα in microglia from wt or Hv1−/− mice (n=3). Microglia migrating to the lower well (containing MCP–1 or TNFα) normalized to those migrating without chemoattractant. Data are mean ± s.e.m.
Figure 4
Figure 4. Hv1−/− mice are protected in ischemic stroke
(a) TTC staining of coronal brain sections of wt and Hv1−/− mice 24h after pMCAO under isoflurane. (b) Infarct volume was reduced from 72.3±8.4% in wt mice (n=7) to 39.4±5.8% of total brain in Hv1−/− mice (n=7); isoflurane anesthesia. Smaller infarct volumes in Hv1−/− mice (37±7%, n=11) than that in wt mice (62±8%, n=12) after pMCAO; ketamine/xylazine (Ket/Xyl) anesthesia. (c) Neurological scores after pMCAO showing less neurological impairment in Hv1−/− mice (n=11) than wt mice (n=12). (d) Coronal (upper) and transverse (lower) MRI brain images from wt and Hv1−/− mice 24h after pMCAO. (e) Infarct volumes measured based on coronal MRI images. Individual and pooled data; infarct volume in Hv1−/− mice (124.3±12.3 mm3; n=6) was ~60% of that in wt mice (74.1±15.5 mm3; n=7). (f) Experimental procedure: 1d after pMCAO, the mouse brain was sliced, stained by TTC, and microglia within the slice recorded. TTC staining shows peri-infarct area (seen also in DIC, dotted red line, lower, left). Whole-cell recording of voltage–gated proton currents from ipsilateral (ipsi.) and contralateral (c–lat.) microglia after pMCAO (pHo7.2/pHi6.5) (lower, right). (g) Increase of voltage–gated proton currents in ipsilateral microglia compared to contralateral controls. Inset: Microglial cell surface area (cell capacitance; pF), was smaller in ipsilateral (ipsi.) than contralateral (c–lat.) microglia (n=6). (h) Hv1 protein (α2–Hv1) increased 24h after pMCAO (also see Suppl. Fig. 14d). Spleen was the control (n =3). Data are mean ± s.e.m.
Figure 5
Figure 5. Hv1–deficient mice are relatively protected against ischemic neuronal death
(a) NeuN, cleaved caspase–3, and TUNEL immunostaining of peri–infarct cortex from wt and Hv1−/− mice 24 h after pMCAO. Scale bars=120 µm. (b) Pooled data showing significant fewer caspase–3 positive neurons and TUNEL positive cells after ischemic stroke in Hv1−/− mice compared to wt mice (n=3). (c) Oxygen glucose deprivation (OGD) reduced cell viability as assayed by live/dead cell staining with EthD–1 and calcein–AM. Green=live cells; red=membrane permeant (dead) cells. MG, microglia. Scale bar =120µm. (d) Cell mortality was calculated from live/dead assay as shown in (d). Addition of Hv1−/− microglia to neuronal cultures resulted in less OGD–induced cell death than addition of wt microglia (n=3). Cell counts insured equal numbers of microglia added to each culture. (e) Cell mortality was calculated based on measurement of lactate dehydrogenase (LDH) release. Wt and Hv1−/− neurons exhibited similar sensitivity to OGD (n=3). (f) Microglia–related OGD–induced cell mortality (based on LDH release) was inhibited by DPI, apocynin (Apo), MK801, or by Hv1 shRNA knockdown. Inset shows Hv1 protein expression (α1–Hv1) in microglia treated with scrambled or Hv1 shRNA for 3d (also see Suppl. Fig. 14e). (g) NMDA–induced cell death (upper) or NO release (lower) is comparable between wt and Hv1−/− neurons. Data are mean ± s.e.m.
Figure 6
Figure 6. Microglial Hv1 is critical for ROS production after stroke
(a) Production of ROS and release of glutamate, NO, and cytokines (IL–1β, IL–6, TNFα, INF–γ, VEGF) 30min after OGD from cultured wt and Hv1−/− microglia (n=3). Normalized to wt. (b) Microglia ROS production (ET fluorescence) in brain slices. OGD increased ROS production in wt microglia (n=8) significantly more than in Hv1−/− microglia (n =7). (c) Microglial ROS production in situ detected by i.p. injection of DHE after tMCAO. Microglia were identified by GFP; nuclei in the peri–infarct cortex identified by DAPI. Scale bar=30 µm. (d) Microglial ROS production in Hv1−/− mice was increased in ipsilateral (ipsi.) compared to contralateral brain (n=13; c–lat. Side, 21; ipsi.) and compared to wt mice (n=15; c–lat., 20; ipsi.). Microglial ROS production: ratio of ET intensity from ipsi. and c–lat. brain. DAPI intensity in wt and Hv1−/− mice not significantly different. Results in cortex and striatum are similar. (e) Cell body areas of GFP–labeled microglia measured from wt and Hv1−/− mice. (f) Phosphorylation of p65 (P–p65) increased more in wt mice than in Hv1−/− mice after MCAO (also see Suppl. Fig. 14f). No difference in expression of total p65 between wt and Hv1−/− mice (n=3). (g) EUK–207 reduced infarct volume 3d after pMCAO in both wt and Hv1−/− mice (TTC). (h) EUK–207 rescue of brain damage is greater in wt (n=8) than in Hv1−/− mice (n=7), while there is no protection by MK801 in wt (n=8) and Hv1−/− mice (n=9). Data are mean ± s.e.m.
Figure 7
Figure 7. Microglial, but not leukocyte, Hv1 is responsible for brain damage after ischemic stroke
(a) Transcripts of NOX1, NOX2, NOX3, NOX4, Hv1 and 18s rRNA were examined in wt and Hv1−/− microglia using qRT–PCR. The NOX2 transcript level is similar in wt and Hv1−/− microglia (n=4 each group). (b) Western blot showing similar NOX2 expression in wt and Hv1−/− microglia. After MCAO or OGD, NOX2 expression increased significantly (also see Suppl. Fig. 14g). (c) Infarct volume (TTC staining) in chimeras of wt>wt, wt> Hv1−/−, Hv1−/−>wt, and Hv1−/−> Hv1−/− mice. (d) Pooled data show significantly more brain damage in Hv1−/−>wt mice (n=7) than in wt>Hv1−/− mice (n=7). Data are mean ± s.e.m.

Similar articles

Cited by

References

    1. Nathan C, Ding A. SnapShot: Reactive Oxygen Intermediates (ROI) Cell. 2010;140:951–951. e952. - PubMed
    1. Steinhubl SR. Why have antioxidants failed in clinical trials? Am J Cardiol. 2008;101:14D–19D. - PubMed
    1. Bedard K, Krause KH. The NOX family of ROS-generating NADPH oxidases: physiology and pathophysiology. Physiol Rev. 2007;87:245–313. - PubMed
    1. Dringen R. Oxidative and antioxidative potential of brain microglial cells. Antioxid Redox Signal. 2005;7:1223–1233. - PubMed
    1. Walder CE, et al. Ischemic stroke injury is reduced in mice lacking a functional NADPH oxidase. Stroke. 1997;28:2252–2258. - PubMed

Publication types